우리는 세계 대기질 지수(World Air Quality Index) 프로젝트 에 게시된 수치에 대해 질문하고 다른 웹사이트에 표시된 값과의 차이에 대해 궁금해하는 사용자들의 문의를 매우 자주 받습니다. 대기 질 지수(AQI)라고도 불리는 숫자는 초보자에게 매우 혼란스러울 수 있기 때문에 이는 실제로 정상적인 현상입니다. 우리가 받은 마지막 메시지는 다음과 같습니다.
저희는 작년부터 중국 텐진의 공기질 지수를 확인해 왔는데, 귀하의 웹사이트와 귀하의 웹사이트에 명시된 다른 공식 웹사이트(air.tjemc.org.cn) 사이에 데이터가 너무 큰 차이가 있다는 것을 발견했습니다. 실외인지 실내인지 판단에 영향을 미치기 때문에 어느 쪽이 더 정확한 데이터를 제공할 수 있을지 궁금합니다. 이 문제를 해결하도록 도와주세요. 감사합니다!
예를 들어 상하이, 싱가포르 PSI 및 PM 2.5 AQI 에 대한 비교 PM 2.5 데이터 와 최근에는 Nowcast 에 대해 우리는 이전에 이 문제에 대해 많은 글을 썼습니다.
하지만 여전히 많은 질문을 받고 있기 때문에 이제 전 세계에서 사용되는 AQI 척도의 차이점을 설명하기 위해 이 기사를 작성하게 되었습니다.
이 기사의 첫 번째 부분에서는 중국에 초점을 맞추고 두 번째 부분에서는 일본, 한국, 인도, 태국, 말레이시아, 유럽, 멕시코 등에서 사용되는 저울에 대한 비교를 확대할 것입니다.
중국 천진의 대기 질 지수에 대한 초기 질문으로 돌아가서 아래 두 사진은 천진의 EPA 웹사이트 air.tjemc.org.cn의 스냅샷입니다. 왼쪽 사진은 PM 2.5 농도를, 오른쪽 사진은 변환된 AQI를 보여줍니다.
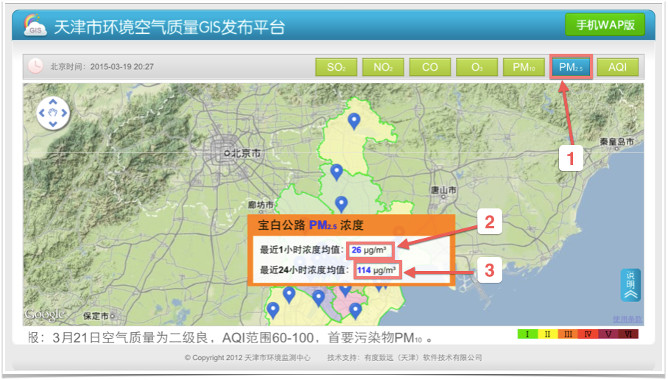 | 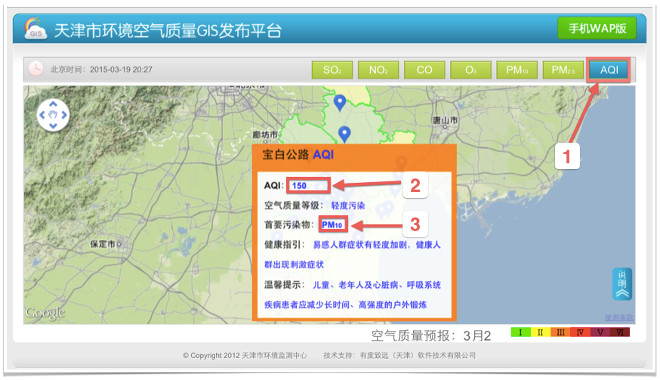 | 1 hour 2 and 24-hours 3 average PM2.5 readings 1 in µg/m3 | AQI values 2 and dominent pollutant 3 |
왼쪽 그림에서 시작하여 2 와 3 으로 강조 표시된 값은 실제로 AQI 척도로 변환되지 않고 단지 입방미터당 마이크로그램(μg/ m 3 )으로 표시되는 일반 원시 판독값입니다. 원시 값을 제공하는 것이 이상하다고 생각할 수도 있지만 실제로는 예상보다 훨씬 더 자주 발생합니다.
전 세계의 많은 환경 보호국(EPB)은 변환되지 않은 원시 가치를 제공하고 있습니다.
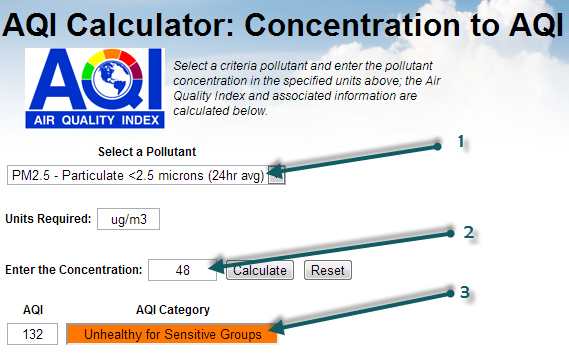
세계대기질지수(World Air Quality Index) 프로젝트에서는 US EPA 척도로 변환된 값만 제공됩니다. 원시 값을 US EPA 척도로 변환하려면 airnow 계산기 (오른쪽 스냅샷)를 사용하거나 동일한 계산기 의 자체 버전을 사용할 수 있습니다.
계산기 사용은 간단합니다. 예를 들어 PM2.5 판독값을 변환하려면 PM 2.5 오염물질 1 을 선택한 다음 질량 농도 2 를 입력하고 마지막으로 계산을 클릭하여 해당 AQI 수치 3 을 얻습니다.
따라서, 타 웹사이트에서 제공하는 대기질 데이터를 확인할 때에는 항상 해당 데이터의 단위를 주의깊게 확인하고, µg/ m 3 로 표시하는 경우 반드시 AQI 척도로 환산하여 표시하시기 바랍니다. 세계 대기질 지수(World Air Quality Index) 프로젝트에서는 24시간 평균이 아닌 1시간 판독값을 기반으로 한 AQI만 제공됩니다. 설명이 궁금하시다면 나우캐스트 관련 포스팅을 확인해보세요.
그런 다음 오른쪽 그림(AQI 판독값)의 경우 전 세계적으로 다양한 종류의 AQI 척도가 있기 때문에 약간 더 복잡해집니다.
세계보건기구 (WHO)는 축적된 과학적 증거를 검토해 공기질 지침을 제시하고 있다.
하지만 거의 모든 국가에는 고유한 척도가 있으며, 이는 HJ 633-2012 라는 척도를 사용하는 중국의 경우에도 마찬가지입니다. 세계대기질지수(World Air Quality Index) 프로젝트에 사용되는 것은 US EPA 척도 입니다. 그러나 많은 말보다 그래픽이 더 좋기 때문에 여기에 PM 2.5 오염물질에 대한 두 가지 척도가 있습니다.
가장 중요한 것은 AQI가 200 이상인 경우 두 척도가 동일한 중단점을 갖는다는 점입니다. 그러니 다음 번에 다른 웹사이트에서 제공하는 공기질 데이터를 확인할 때 항상 해당 데이터의 단위를 주의 깊게 확인하고, 어떤 AQI 척도를 사용하고 있는지 다시 한 번 확인하시기 바랍니다.
이 기사의 두 번째 부분에서는 세계에서 사용되는 다른 척도에 대해 쓸 것이며, 예를 들어 울란바토르에 사용되는 AQI 척도와 100-250 저공해 범위와 같은 매우 흥미로운 놀라움이 있을 것입니다.
--
