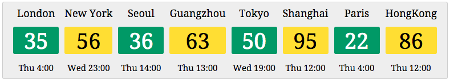
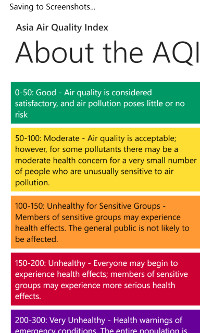
Are you wondering what the different colors and numbers below mean?
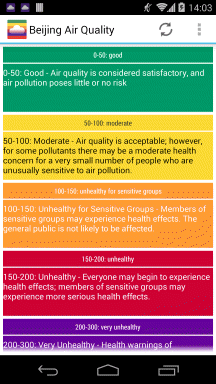
The numbers are the Air Quality Indexes, which is based on a scale from 0 (good) to 500 (bad).The colors correspond to the different health impact categories (good, moderate, unhealthy... hazardous)
(credits)
Back in 2008, when the World Air Quality project started, all of the existing air quality monitoring stations where based on highly professional and expensive BAM and TOEM technology. This kind of stations are always maintained by professional and highly qualified operators - and this ensures that the output of this station can be trusted.
12 years later, the BAM and TOEM stations still do exist. But with the development of laser scattering technology and low-cost dust sensor, the BAM and TOEM stations are now outnumbered by immense and dense low-cost sensor networks. Nowdays, there are just so many of those networks - to name a few: urad, luft-daten, airqo, airbg, opensense, yakkaw, econet, airkaz, ccdc, ambente, green air, etc..
Univ. of Arizona (credits)
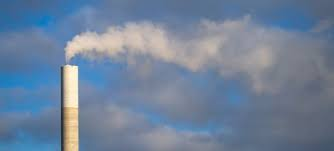
A common question asked is why are nitrogen dioxide (NO2), sulphur dioxide (SO2) and carbon monoxide (CO) concentrations always so low and is measuring them useful?
To highlight the importance of monitoring these substances this article is going to explain where these pollutants come from and how to they affect our health and the environment.
To keep things short this article will just focus on NO2.
Univ. of Arizona (credits)
It is already several months since the US EPA updated its AQI standard for Ozone 8 hours breakpoints. This is definitely a positive step towards strengthening Air Quality in the USA, since the US EPA Standard was actually among of the least conservative standard for Ozone, compared, for instance, to similar standards in India, China or Europe!
But more interestingly, AirNow recently took a step further by introducing the Ozone NowCast formula, which allows to use the weighted 8 hours breakpoint standard in place of the 1 hour breakpoint. This change, which the AirNow team did not widely communicate to the public, makes quite a change to the way Ozone AQI is reported, and this is what we will be looking at in this article.

During the past months, the World Air Quality team has been working on analyzing several new Air Quality forecast models, as well as improving the Air Quality forecast model demonstrator.
This article will present the latest forecast model demonstrator, which is based on the Gridded Population of the World (GPW), and which will be applied to analyze the Air Quality forecast for the Northern India region (including Bangladesh, Pakistan and Nepal).
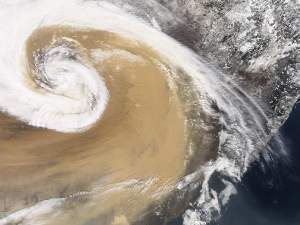
We have been writing quite a few times about the influence of wind on air pollution, and how strong winds (or, to be more precise, strong ventilation) can help to clean the air in a very short time. But we never had the opportunity to create on a dynamic visualization of this phenomenon, so this is what this article will be writing about.
It is almost two months since our colleagues from the UNEP have been making an interesting move towards promoting the idea that Air Quality is as important as any other business within the United Nations. They started to invest in this domain, and came up with the excellent initiative to create an open footprint for affordable Air Quality Monitoring Stations.
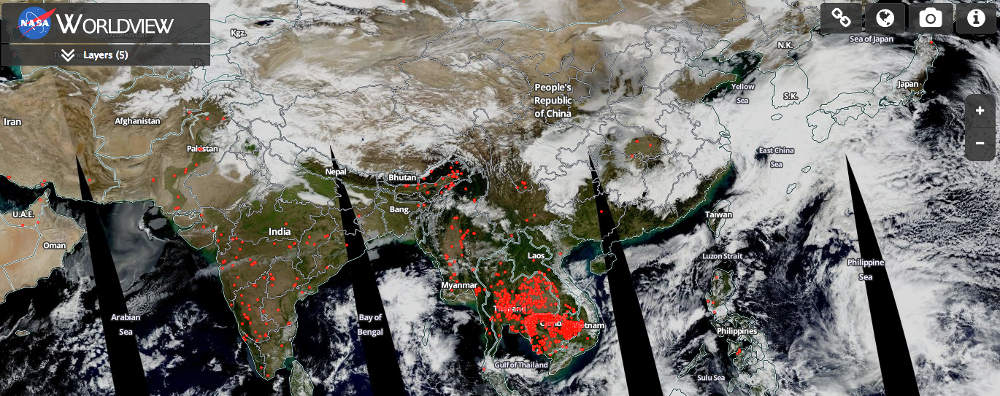
This is a small contribution form the World Air Quality Index project to the ASMC - ASEAN Specialised Meteorological Centre (asmc.asean.org) during this heavy period of Haze in South Asia.
We have been recently cooperating with quite a few more EPAs (environmental protection agencies) world-wide. Among all the requests which we have had, it is actually to provide a Web Map Service so that the EPA themselves can include the real-time Air Quality data onto the map from their website.
One of the obvious advantages of using such a map web service from us is to benefit from the trans-boundary data which we are curating, i.e. a world-wide Air Quality information is provided without country boundary limits.
The second advantage is not only that this is a free service, but it is also completely compatible with standard map technologies from google, bing or leaflet, which allows a quick and easy integration with any existing website.
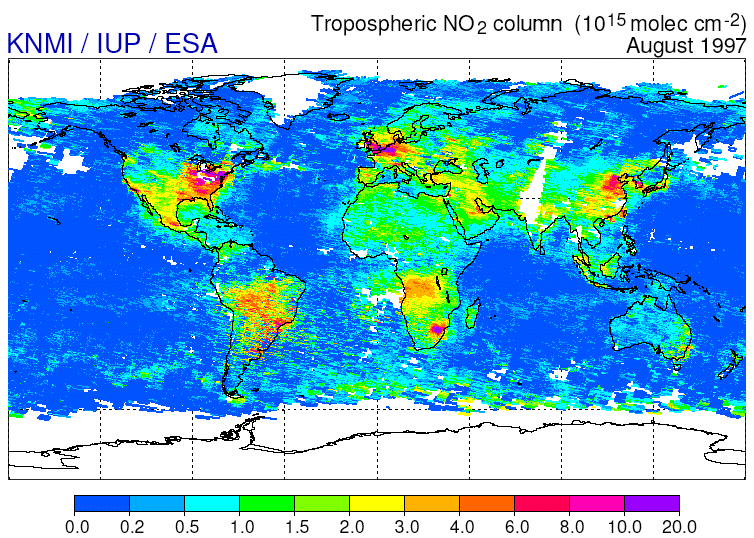
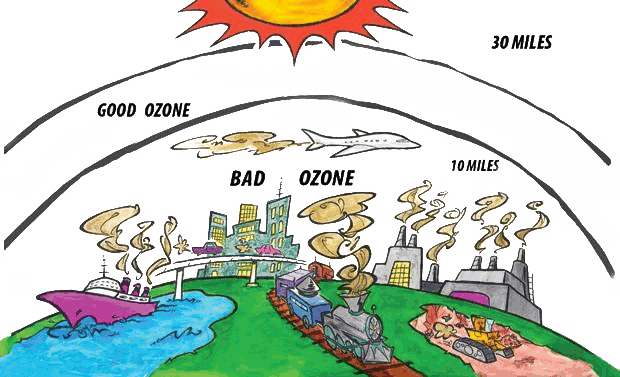
The ambient Ozone, refered as O3 and also called called ground-level or tropospheric Ozone impacts everyone on earth regardless of the country, as shown on the image on the right .
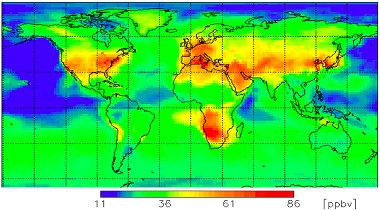
(Attribution: WMO GAW research on reactive gases )
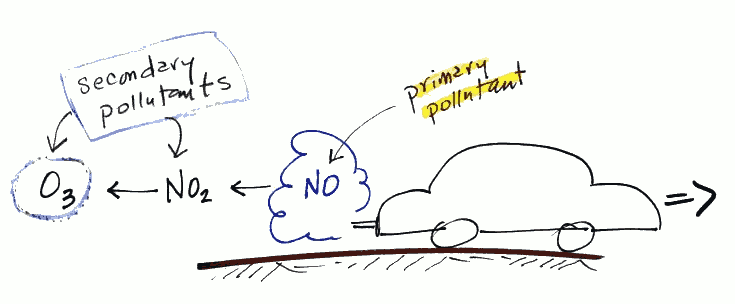
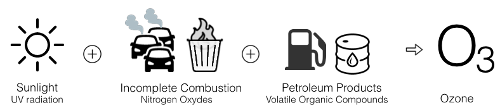
Unlike particulate matter (PM2.5), the ground-level Ozone is not emitted directly. It is instead produced through a series of chemical reactions that occur in presence of nitrogen oxides, volatile organic compounds, sunlight and high temperatures, as shown on the following visual:
Quantifying the impact of this ground level Ozone on Health is done via the Air Quality Index standard which each country defines. What is interesting is that half of the world is using a standard based on milligrams measurement, while the rest is using ppb based measurement. But is this really a problem? This is what we will be looking at in this article.

Inspekcja Ochrony Środowiska.
(Inspection of Environmental Protection)
The Air Quality data for Poland has been available for a while, but we recently got few questions about the AQI scale used by the Inspekcja Ochrony Środowiska, i.e. the regional inspections of Environmental Protection, and how it differs with the scale used on the World Air Quality Index project. One of them is from Sylwia, who asked:
I am confused with all those numbers, and why there is a difference with the numbers shown on the Warsaw EPA website.
Could you please kindly inform me about the source of the data in Warsaw and the reliability of the data you provide with?
This is actually a very good question, since, when it comes to data, no one should take data as "granted" (refering to the excellent TED talk from Talithia Williams on 'Own your body's data'). This is also the reason why the World Air Quality Index project exists, i.e. to explain every one how to understand the number behind air pollution.
In order to improve the integration of our AQI widgets within external websites, we have developped a new widget API feed. Compared to the existing widget feed, this new API feed provides much more flexibility for the integration, but also many more options for customzing the widget appearance.
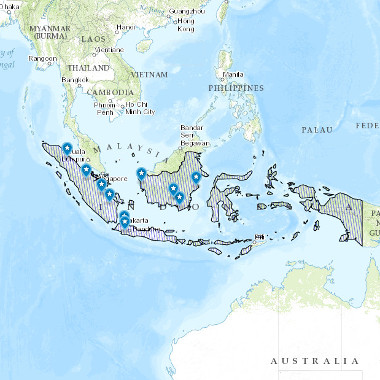
Real-time Air Quality data for is now available for Indonesia. 10 stations located in major cities across Indonesia are measuring in real-time PM10 pollution.
The monitoring stations are operated by BMKG (Badan Meteorologi Klimatologi dan Geofisika), the Indonesian Department of Meteorology, Climatology and Geophysics.
The Air Quality data for Montreal and Quebec has been available for a while, but we recently got few questions about the AQI scale used in this part of Canada. One of them is from Marie A., who asked:
I would like to know why the Air Quality Index on your web site is different from the AQI on the Montreal's website? Do you recalculate anything to meet the US EPA AQI standards? If so, how? With what data?
This is indeed a very good question. and we will explain in this article the different scales in use, how the scales compare to each other, and how the convertion can be done.

Thanks to the World Air Quality Index project community, translations for the Polish language are now available for the Website and web-application. Many thanks especillay to the user "AiRs" for the excellent contribution.
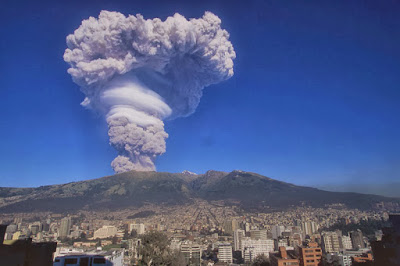
Guagua Pichincha volcano in Ecuador (Attribution)
Beijing citizens do know for long that the best natural way to clean the pollution in the air is strong winds from the North, while winds from the south might, on the contrary, bring more pollution from Hebei.
In Quito, Ecuador, there is a similar problematic, except that the pollution comes from the active volcanos. Fortunately, they do not erupt that often, but when they erupt, better avoid being under the the heavy ash cloud formed by the explosive eruptions (see picture).
It is already a long time since the Hong Kong EPA has updated its Air Quality Index standard from the traditional Air Pollution Index to the so called Air Quality Health Index (AQHI), but we never got a change until now to have a deeper look at it, which we will do in this article.
The Hong Kong EPA has actually done an excellent work at explaining how the AQHI is defined, and the information one needs to understand the AQHI is available from their website. The most obvious simplification is the change of the traditional 0-500 index into a new simplifed 0-10+ range, sub-divded in five health risk categories, as shown below:
| LOW | MODERATE | HIGH | VERY HIGH | SERIOUS | |||||||||||||||||
| | | | | 1 | 2 | 3 | 4 | 5 | 6 | 7 | 8 | 9 | 10 | 10+ | | ||||||
But there is actually much more than a range simplification: the new AQHI is also introducing the very clever concept of Added Health Risk (%AR), which was originally defined, in 2007, by a team of four partners from South Africa, and first used in Canada.
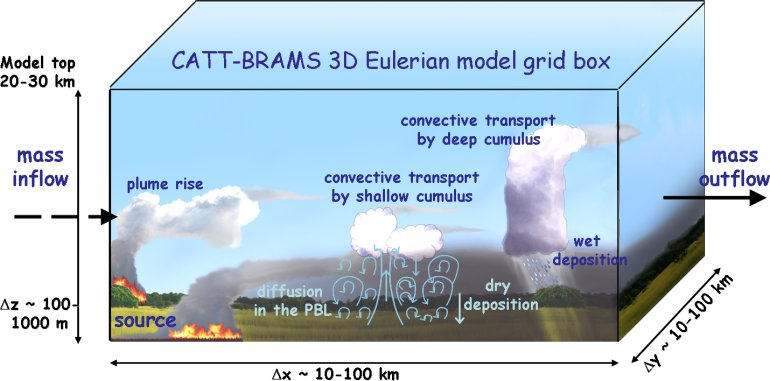
The Air Quality forecast for South America is now available on the World Air Quality Index project, in parnership with the Brazilian Centro de Previsão do Tempo e Estudos Climáticos (CPTEC). The forecast can be accessed freely accessed from cptec.inpe.br as well as forecast/ south-america/.
The CPTEC team has done an excellent work at providing a simple and detailed explanation on the underlying concepts used by their forecast model, called BRAMS (for Brazilian developments on the Regional Atmospheric Modelling System). The picture below (from the CPTEC) is giving an insight on the workflow for their model (source -> transport -> deposition).
(Attribution: Houston Clean Air Network )
The ground Ozone Air Quality Index calculation has just been updated to follow the Instant Cast concept, i.e. to report the pollution right now instead of the pollution from the previous hours. For more information about the Instant Cast, please refer to this article.
The calculation for the Ozone Index is now using the hourly reading, instead of the previous 8 hours average, but still applying the same 8 hours AQI breakpoints formula for AQI below 100. The previous procedure for calculating the 8-hour average concentrations is not used any more for Instant reporting. Above AQI 100, the normal 1 hour Ozone breakpoints are used (while before, the AQI above 100 was defined as the maximum of the 1 hour and 8 hours readings).

It is already more than one year since the World Health Organization has released their 'Ambient (outdoor) air pollution in cities database 2014'. The WHO team who worked on this project have done an excellent work at gathering the data for so many countries, and putting it all together in a single place accessible for all.
We wrote about it in several of our past articles (like for the Air Quality in Africa or in Latin America), but we never had the chance to look at the different options to visualize their data set. So, this is what we will be writing about in this article.
(Tiranga, तिरंगा)
The Indian Central Pollution Control Board has recently announced, in April 2015, the publication of India's National Air Quality Index Standard (NAQI ). All the details on this standard are available from CPCB, wikipedia or from this report from Indian Institute of Technology, Kanpur (iitk.ac.in).
This is actually a very important step forward in the Air Quality world awarness, since the air pollution in each country is very much specific to the country pollution type: For instance because of Dust (in Arabic Peninsula), because of Transport (New Delhi) or topography (Chile).
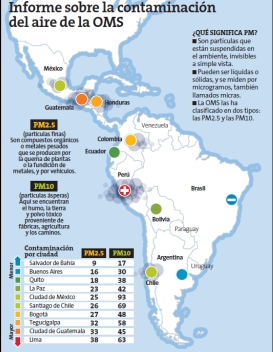
Latin America, just like any other continent in our world is facing Air Pollution. The recent 2014 report by the World Health Organization on Ambient (outdoor) Air Pollution gives some annual mean figures for several cities in Latin America. Without surprise, the worst scenarios are in Asia, but yet, some cities in Latin America have high indexes too (see table on the left).
The ranking from the WHO should however by considered carefully, especially considering the measurement methods used the report can be argued - for instance, for Lima, the Peruvian EPA is arguing that the data from the WHO is not correct because the samples were not taken in the right places (read this article from P. Estupinya for full feedback from several countries). This is actually for this reason that we only publish real-time information on the World Air Quality project since we do believe than more than ranking, it is the current conditions that are important for the world citizen.
(Jalur Gemilang)
Air Quality for Malaysia has been available for a long time, but unlike other countries, only the composite AQI is provided. The AQI for the individual pollutants such as PM10, Ozone ... is not available, which makes the convertion to the US EPA scale more difficult.
Fortunately, the information about the AQI scale used in Malaysia, also known as API (for Air Pollutant Index) is clearly explained in the document 'A guide to Air Pollutant Index in Malaysia'.
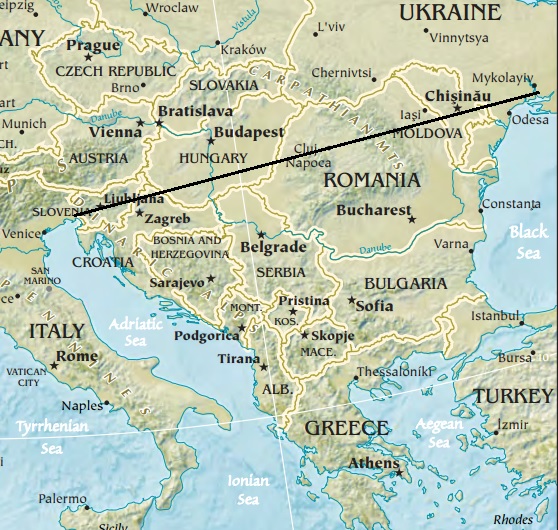
The Balkan Peninsula, popularly referred to as the Balkans, is a geographical region of Southeast Europe. The region takes its name from the Balkan Mountains that stretch from the east of Serbia to the Black Sea at the east of Bulgaria.
Many of the countries in the Balkans are providing real-time Air Quality readings. The data for Turkey (Thrace), Romania and Croatia have already been available on the World Air Quality Index project for a long time. Today, we are able to roll-out the data for 3 new countries: Serbia, Bulgaria and Macedonia.

We had the honor to be invited by Dr Pawan Gupta from the NASA Applied Remote Sensing Training (ARSET) team to give a presentation about our World Air Quality Index project at the Earth Observations and Tools for Air Quality Applications webinar:

When talking about Air Quality, the first countries that comes to people's mind are China and India, and more generally Asia. Even on the World Air Quality Index project, Asia has always been, since the begining, our strong focus (most likely because this is where our HQ is located!).
Few years ago, in 2012, we decided to extend our scope to cover the other seven continents, starting with Oceania, and then following with Europe and North America, South America.
But one of seven continents, namely Africa, has been surprisingly lacking behind. We received many inquiries about this lack of data, and one of the last was from Said E. who wrote:
Thanks for making the World Air Quality Index project site. It gives very useful information.
My only concern is why Africa is not considered.
For information I am a moroccan citizen.
")
STRONG LAPSE CONDITION (LOOPING)
")
WEAK LAPSE CONDITION (CONING)
")
INVERSION CONDITION (FANNING)
Examples of Atmospheric Stability (attribution)
In weather prediction, forecast models are used to predict future states of the atmosphere, based on how the climate system evolves with time from an initial state.
While the forecast models are quite complex (and do require strong scientific and engineering capabilities), the science of analyzing those forecast models, and verifying their accuracy, by comparing actual empirical observations to predicted values, is quite straightforward.
For the domain of Air Quality, just like for weather prediction, it is possible to define models used to predict the future set of atmospheric pollution. There are actually plenty of such models, often referred as Atmospheric Dispersion Modeling. And just like weather prediction, the same concept of accuracy analysis can be applied to Atmospheric pollution predictions.
Very often we receive inquiries from users asking about the numbers published on the World Air Quality Index project, and wondering about the difference with the values expressed in other websites. And that's actually normal, since the numbers, also called Air Quality Indexes (AQI), can be very confusing for beginners. The last message we received is the following one:
We have been checking air quality index for the Tianjin, China since last year, however we found the data has such a big difference between your website and another official (air.tjemc.org.cn) one which is stated on yours as well. I am wondering which one can provide more accurate data, as it will affect the decision for outdoor or indoor. Please help me with this issue. Thank you!
We have been writing quite a lot about this issue before, for instance from a comparative PM2.5 data for shanghai, singapore PSI and PM2.5 AQI and more recently about the nowcast.
But, because we are still getting many questions, we are now writing this article to explain the difference of the AQI scales used all over the world.
Back in March 2015, we had the chance to meet in Beijing several environmental specialists from the US State Department as well as the China Mission (the famous entity running the PM2.5 monitors in the Beijing US embassy).
Among all the topics that were addressed, there is one worth writing about, namely the "nowcast" system. This system used by the US EPA to convert the raw pollutants readings, expressed in µg/m3 or ppb, into the AQI (scale from 0 to 500). It is used for all the AQI values reported on the airnow.gov website.
The concept behind the nowcast is to compensate the "24 hours averaging", which should be used when converting concentrations to AQI. The reason for this averaging is that the AQI scale specifies that each of the Levels of Health Concern (i.e. Good, Moderate,... Unhealthy...) is valid under a 24 hours exposure[1]. For example, when seeing a 188 AQI (Unhealthy), one need to read it as "if I stay out for 24 hours, and the AQI is 188 during those 24 hours, then the health effect is Unhealthy". This is quite different from saying that "if the AQI reported now is 188, then the health effect is Unhealthy".

We have just stepped in the Lunar New Year of the Goat (combined with the Wood element for 2015), and, for the World Air Quality Index project team, that means full speed working on extending the Air Quality monitoring to new countries in South East Asia. Namely: The Philippines, Cambodia and Indonesia (and more, e.g. Myanmar and Laos, will follow very soon).
As there is also a huge demand for PM2.5 monitoring for Thailand (especially Chiang Mai and Bangkok), or for more station in Vietnam (Ho Chi Minh City), the extension will also cover selected countries with existing network.
But, this time, unlike for the previous countries, we do need the help of everyone, and especially your help if you are living in one of those countries. The reason is that, this time, since the real-time Air Quality information is not publicly available from the Environmental Protection Agencies (EPA) of those countries, the World Air Quality Index project will start to crowdsource Air Quality monitoring stations in the main cities of the above countries1.
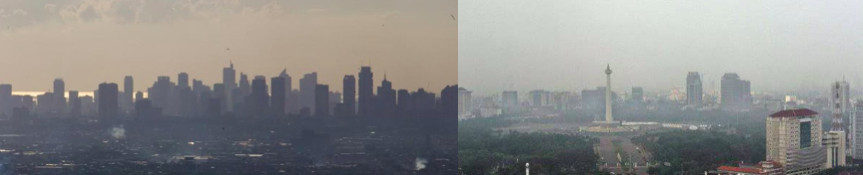
Visible Air Pollution on the Manilla and Jakarta Skylines
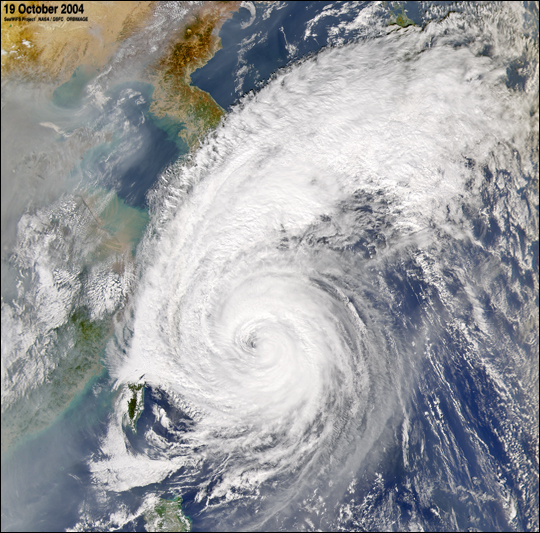
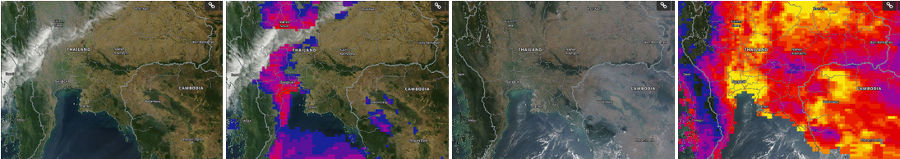
We recentely had the privilege to start a cooperation with the NASA Remote Sensing monitoring program.;
The objective is to use the Remote Air Quality sensing based on the NASA Satelites to determine the Air Quality in areas where sensors are not available (e.g. over the sea, but also for countries where sensors are not yet available).
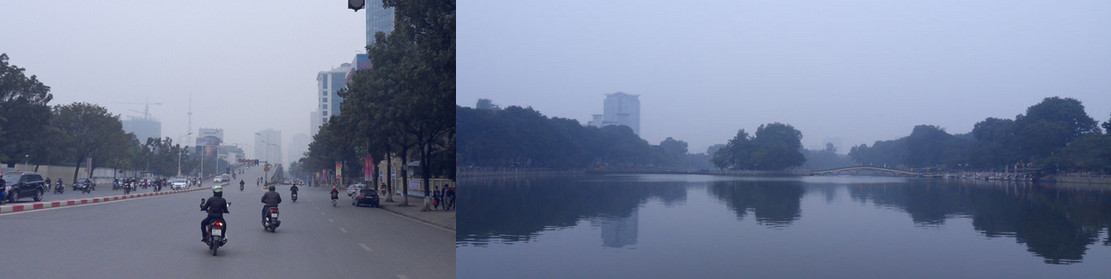
Earlier this week (of February 2015), we got several inquries from Hanoi citizen wondering about the Air Quality Index which was displayed on the Hanoi page (city/vietnam/hanoi).
The main reason for the inquiry was that the Air Quality Index displayed on the World Air Quality Index project was around 50 (green AQI) level, while the outdoor visibilty in Hanoi looked like this:
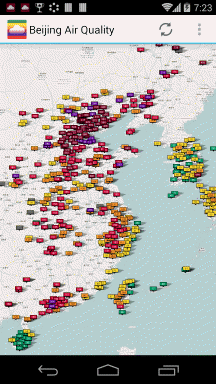
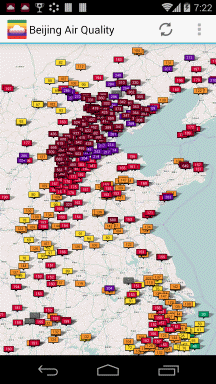
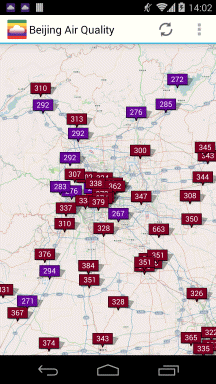
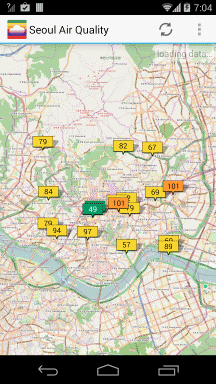
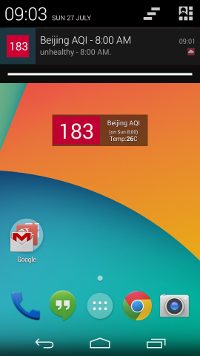
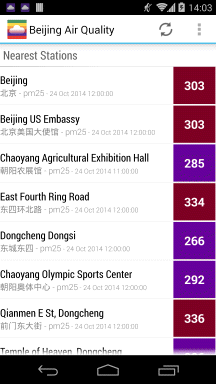
The latest version 3.2 of the World Air Quality Index project Android application has just been released, and comes with few new cool features:
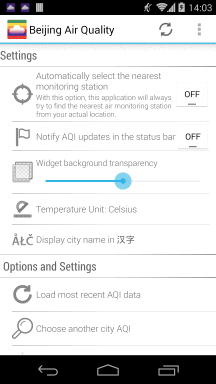
The embedded map which will let you navigate through the world air monitoring station directly from the app and the wind and temperature forecast tab which gives you the coming 3 days forecast. We have also been working on refreshing the visual and updating settings to support, for instance, Fahrenheit temperature display.
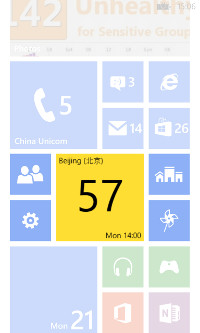
(Asia)
(North China)
(Beijing)
(Seoul)
Forecast
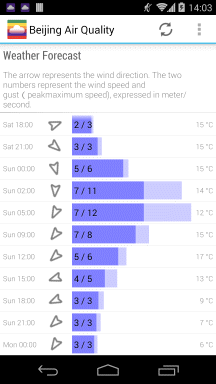
and wind conditions
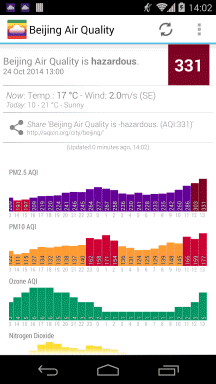
Widgets
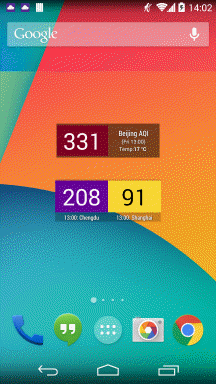
when AQI > 150
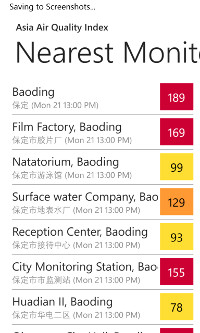
the nearest stations
Explanations
Like every other year since 2002, our collegues from Clean Air Asia (aka Clean Air Initiative) are organiznig the biennial Better Quality Conference (baq2014est.org). This time, it will take place in Sri Lanka, from November 19th to 21st 2014, and will be co-hosted together with the Environmentally Sustainable Transport (EST) forum.
The "Integrated Conference of BAQ 2014 and Intergovernmental 8th Regional EST Forum in Asia" co-organized by the Ministry of Transport of Sri Lanka, The Ministry of Environment and Renewable Energy of Sri Lanka, Ministry of the Environment of Japan, United Nations Centre for Regional Development, and Clean Air Asia, in partnership with the Asian Development Bank, German International Cooperation (GIZ), and World Bank.
This year theme is "Next Generation Solutions for Clean Air and Sustainable Transport − Towards a Livable Society in Asia":
Recognizing that clean air and sustainable transport are essential to a livable society in Asia, we call for innovative and smart solutions (policy, institution, technology and financing) that significantly reduce air pollution and greenhouse gases from energy, industry, transport, and area sources, and ensure a safe, equitable, environment and people-friendly transport system by accelerating the shift towards more environmentally sustainable transport (EST) in Asian cities and countries.
Check out the program. More than 800 participants are expected to join the BAQ 2014, and we will be part of them, presenting our recent research on affordable air quality monitoring solution we have been conducting within our research lab.
The Air Quality data for Perth and Western Australia is finally available after a long waiting time.
The department of Environmental Regulation (D.E.R.) from the government of Western Australia, is now publishing the data on their site: der.wa.gov.au/your-environment/air.
While the link to the DEC site is still not working, the feed can be accessed from this new page.
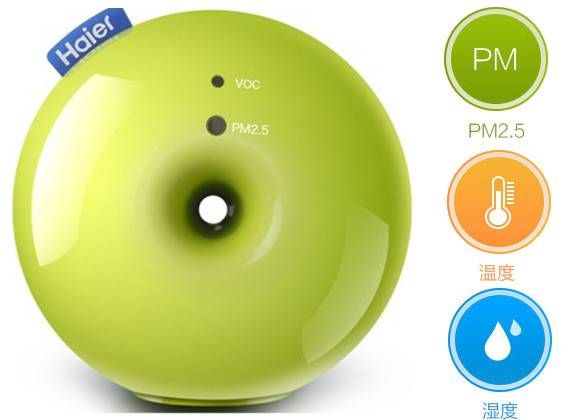
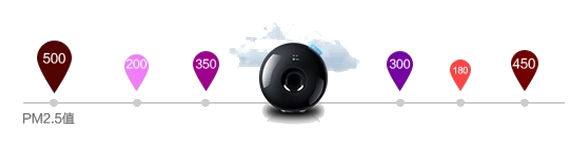
You might have stumbled on one of Haier recent product called the "Air Box" (海尔空气盒子), available from jd.com or taobao for an affordable 399RMB. It is very beautifully designed product, aimed, as part of their smart living concept, at being used in conjunction with smart air conditioner.
It *claims* to be able to detect and measure both Volatile Organic Compound (VOC, i.e Ozone), as well as the famous small PM2.5 particulate matter. But can it really do so? To know the answer, check our latest on-going experiment about the Air Box at experiments/haier-air-box
--
Note: this article was written in 2013. While the Dylos monitor is still a good product, there is nowdays much better and affordable monitoring products, so we do not recommend purchasing the Dylos product anymore.
You can for instance check the GAIA air quality monitoring stations product range from ES Labs.
The Dylos Air Particle Counter experiment is still going-on, and has been on for now 50 days. So, last weekend, as the air pollution in Beijing was getting really low - thanks to strong north winds, we used this time as an opportunity to perform a maintenance break... on the Dylos monitor itself.
The reason is that, even if the Dylos monitor is definitely well designed and engineered equipment (we do mean it), it maybe not be so well conceived to subsist Beijing's tough episodic Air Pollution.
It all started after noticing that the correlation graphs between the Dylos and BAM monitor tend to show some systematic signs of leveling beyond 38,000 particles (≥0.5µ). This kind of saturation symptom can be the consequence of internal air inflow bottleneck, which can be caused by "saturated" air channels. During times of heavy pollution, this phenomenon is totally normal due to the large amount of particulate matter having to go through the air channel.
So, no surprise, after opening the Dylos monitor, we confirmed that the internal air channels are definitely saturated, by an accumulation of dust during the last 50 days:
")

-Beijing dust impact on the Dylos air particle counter internal structure-
The result of cleaning the internal structure, using a fine brush, would produce an astonishing amount of dust - and this, just after 50 days of outdoor experimentation. Just think that this is what you are breathing...

-The real Beijing dust... the one Beijiners breathe during heavy pollution day!-
Actually, having to perform such cleaning and maintenance on the Dylos equipment is not a surprise, since even the very expensive BAM equipment requires monthly maintenance by skilled operators.
--
The following part has been added 10 days after the initial post was published:
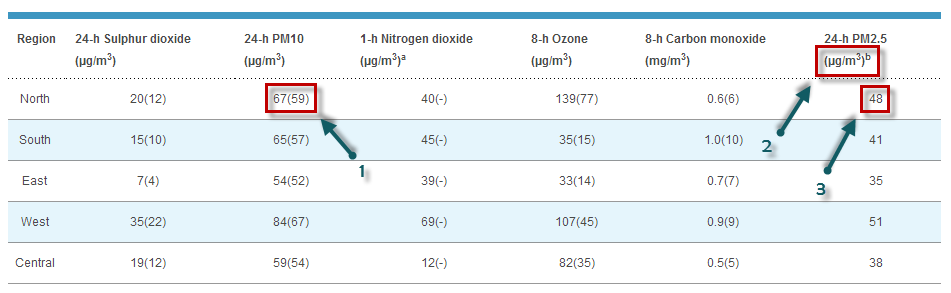
It is now 10 days since the cleaning has been done, and the situation has definitely improved for the correlation between BAM and Dylos. From the graph below, which shows the measurements before and after the cleaning, the zone indicated with number (2) shows a very good similarity (correlation) between BAM and Dylos. But, under condition of heavy pollution, there are still consistent signs of leveling (deviation in measurement), as highlighted with zone number (1) and (3). The deviation seems however less worse after the cleaning (zone (3)) than before (zone (1)). We are contacting the Dylos company, to consult them on this leveling phenomenon, and will update this post later.
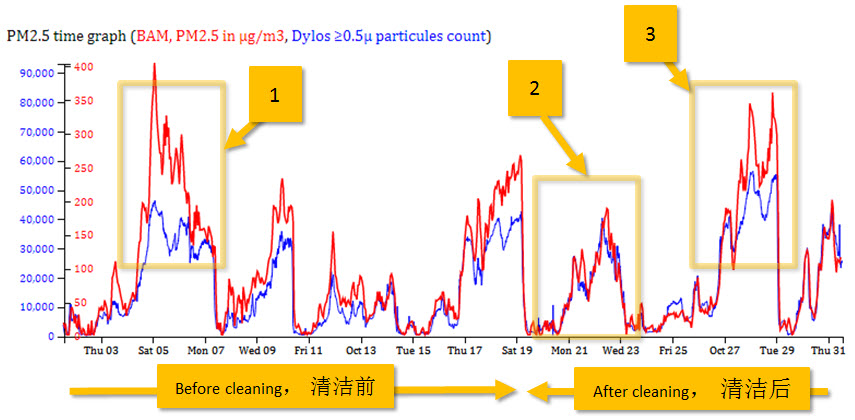
(Click on the picture to open the real time version)
--
For some historical reason, the AQI convertion formula used for some of the cities on the World Air Quality Index project were not using the updated 2012 EPA PM2.5 standard. (This is only relevant for cities in Asia, like Japan and Taiwan. Other continents (America, Europe and Australia) have always been using the 2012 standard.
The main change is this updated EPA standard, published on December 14th 2012, compared to the previous one (published in 1999), is to reduce (limit) the PM2.5 AQI level 50 from 15µg/m3 to 12µg/m3, and this in order to enforce more strict air quality standards.
Since September 9th 2013, all the countries are now using the same PM2.5 AQI conversion scale, which is reflected in this table:
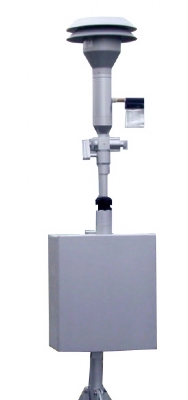
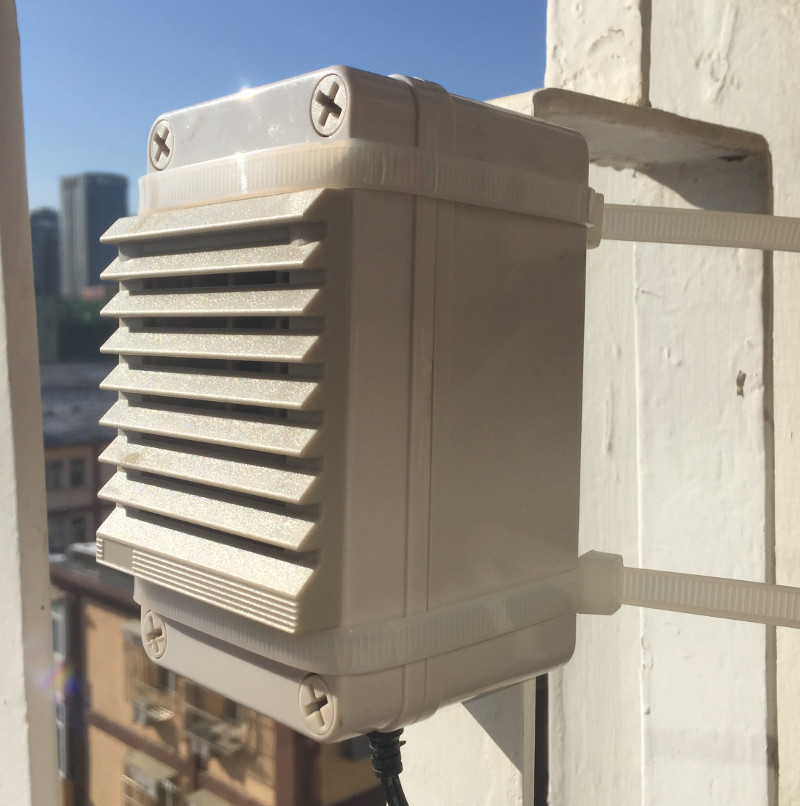
The most common way to measure air quality, as far as it concerns PM10 and PM2.5 particules, is to use the so-called Beta Attenuation Monitors, aka BAM (see picture on the right). Those are profesional equipment, and also the only official equipment used for Air Quality monitoring in China, US, and most of the world. The most famous manufacter is the US-based company called Met-One.
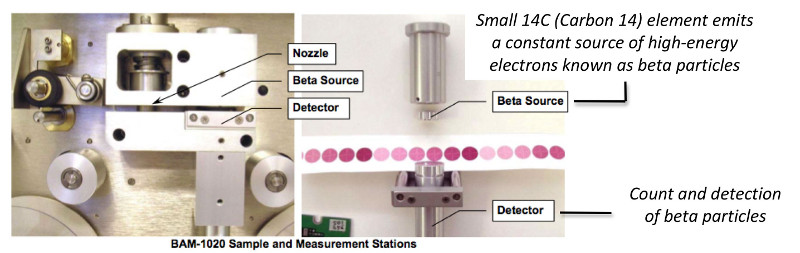
The BAM working principle is quite simple: It measures the decrease in the number of beta particles (electrons) transmitted through a thin layer of particulate matter (PM). As the thickness of the PM layer is increased, the lower the number of beta particules can go through.
The only problem with this kind of BAM equipment is that the cost, estimated to 120K CNY (15K EUR). In China only, there are around 500 of those (around 10 station for each city), and yet, this is not enough as there are still many cities without any PM2.5 readings. In Thailand, there are 21 automatic (i.e. with hourly reading) stations, but none of them provide PM2.5 data. And in Vietnam, there are only 3 stations for the entire country.
With the recent Southeast Asia Smog from Indonesia affecting Singapore and now Malaysia, we got many questions about why there is a difference between the data which can be read from Singapore NEA website (nea.gov.sg) and the World Air Quality Index project Singapore webpage.
For instance, here is what can be read today in NEA website:
For historic reason, the World Air Quality Index project has been using the China MEP (Ministry of Environmental Protection) designation for the air quality levels. This is now past history, and the designation will follow, from now on, the US EPA (Environmental Protection Agency) AirNow standards.
The table below summarizes the differences in designation between the two standards, as well as the translations for the various languages.
While discussing today about the faq entry on PM10 versus PM2.5 which I posted yesterday, my friend Klaus challenged on the usefulness of protection masks. He was actually wondering if the modern masks can nowadays really filter efficiently all the small harmful PM2.5 particulate matter?
Actually, this is a very good question! If you have to wear a mask in Beijing, then better to make sure that it really filters the bad particulates.
Since I did not have the answer to his question, I just dropped an email to Francis Chu from the Singapore totobobo® mask manufacturing company, who replied in almost no time:
We got a very good and relevant question this week from Severine P., who asked about pm2.5 concentrations versus pm10 concentrations. What Severine asked in her mail was:
I don't understand why pm2.5 concentrations are often higher than pm10 concentrations.
Aren't PM smaller than 2.5 micro included in PM smaller than 10 micro?
Thank you for your answer
Severine's question is totally correct: PM2.5 are, by definition, particulates smaller than 2.5 micrometers, so indeed, they should also be included as smaller than 10 micrometers.
and lúwān shī zhuān fùxiǎo (上海师范专科学校附属小学).
The first station is maintained by US Consulate in Shanghai, while the two last ones are provided by Shanghai Environment Monitoring Center(上海市环境监测中心), which is governmental center.
If you have concerns about some stations reporting lower PM2.5 data compared to others, then refer to the following graphics; they show the relative PM2.5 reporting for the last 5 days for each of the above mentioned stations:
About the Air Quality and Pollution Measurement:
| AQI | Air Pollution Level | Health Implications | Cautionary Statement (for PM2.5) |
| 0 - 50 | Good | Air quality is considered satisfactory, and air pollution poses little or no risk | None |
| 51 -100 | Moderate | Air quality is acceptable; however, for some pollutants there may be a moderate health concern for a very small number of people who are unusually sensitive to air pollution. | Active children and adults, and people with respiratory disease, such as asthma, should limit prolonged outdoor exertion. |
| 101-150 | Unhealthy for Sensitive Groups | Members of sensitive groups may experience health effects. The general public is not likely to be affected. | Active children and adults, and people with respiratory disease, such as asthma, should limit prolonged outdoor exertion. |
| 151-200 | Unhealthy | Everyone may begin to experience health effects; members of sensitive groups may experience more serious health effects | Active children and adults, and people with respiratory disease, such as asthma, should avoid prolonged outdoor exertion; everyone else, especially children, should limit prolonged outdoor exertion |
| 201-300 | Very Unhealthy | Health warnings of emergency conditions. The entire population is more likely to be affected. | Active children and adults, and people with respiratory disease, such as asthma, should avoid all outdoor exertion; everyone else, especially children, should limit outdoor exertion. |
| 300+ | Hazardous | Health alert: everyone may experience more serious health effects | Everyone should avoid all outdoor exertion |
To know more about Air Quality and Pollution, check the wikipedia Air Quality topic or the airnow guide to Air Quality and Your Health.
For very useful health advices of Beijing Doctor Richard Saint Cyr MD, check www.myhealthbeijing.com blog.

This page has been generated on Saturday, Jul 27th 2024, 08:02 am CST from jp2n
Settings
Celcius |