Very often we receive inquiries from users asking about the numbers published on the World Air Quality Index project, and wondering about the difference with the values expressed in other websites. And that's actually normal, since the numbers, also called Air Quality Indexes (AQI), can be very confusing for beginners. The last message we received is the following one:
We have been checking air quality index for the Tianjin, China since last year, however we found the data has such a big difference between your website and another official (air.tjemc.org.cn) one which is stated on yours as well. I am wondering which one can provide more accurate data, as it will affect the decision for outdoor or indoor. Please help me with this issue. Thank you!
We have been writing quite a lot about this issue before, for instance from a comparative PM2.5 data for shanghai, singapore PSI and PM2.5 AQI and more recently about the nowcast.
But, because we are still getting many questions, we are now writing this article to explain the difference of the AQI scales used all over the world.
The first part of this article will focus on China, and the second part will extend the comparison to scales used in Japan, South Korea, India, Thailand, Malaysia, Europe, Mexico, etc.
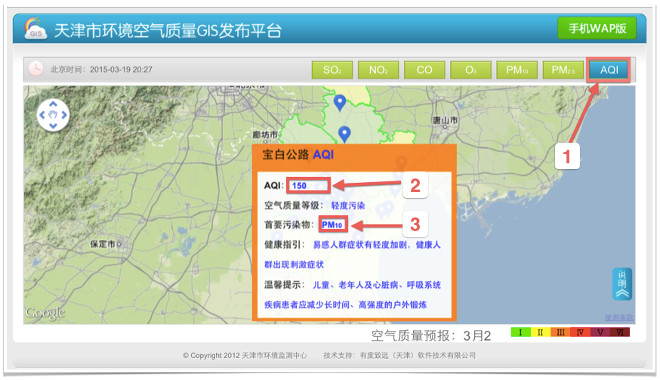
Back to the initial question about the Air Quality Index in Tianjin, China, the two pictures below are snaphots of Tianjin's EPA website air.tjemc.org.cn. The picture on the left shows the PM2.5 concentration, and the one on the right the converted AQI.
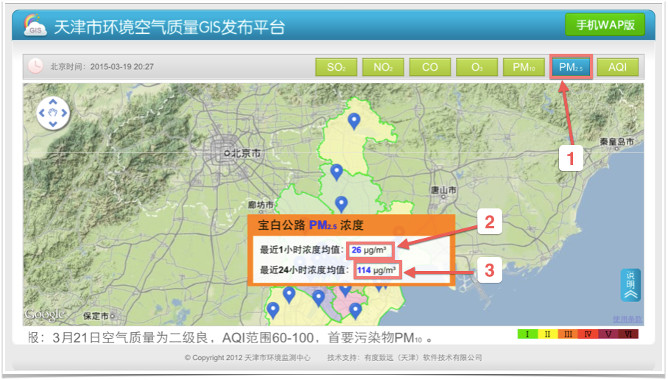 |  | 1 hour 2 and 24-hours 3 average PM2.5 readings 1 in µg/m3 | AQI values 2 and dominent pollutant 3 |
Starting from the picture on the left, the values highlighted as 2 and 3 are acutally not even converted to any AQI scale, but just plain raw readings expressed in micrograms per cubic meter (µg/m3). One might think that providing raw values is odd, but this is actually much more frequent than one would expect.
Many Environmental Protection Bureau (EPB) all over the world are just providing raw unconverted values.
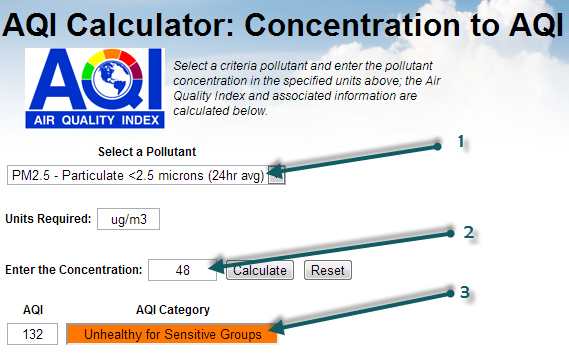
At the World Air Quality Index project, only values converted to the US EPA scale are provided. In order to convert the raw values to the US EPA scale, you can just use the airnow calculator (snapshot on the right), or our own version of the same calculator:
Using the calculator is simple: To convert, for instance, PM2.5 readings, select the PM2.5 pollutant 1, then enter the mass concentration 2, and finally click on Calculate to obtain the corresponding AQI figure 3.
So, when checking Air Quality data provided on other websites, always carefully check the unit for the data, and make sure to convert it to the AQI scale if it is expressed as raw µg/m3. Note that on the World Air Quality Index project, only AQI based on the 1-hour reading (and not the 24-hours average) are provided. If you want to know the explanation, check this post about the nowcast.
Then, for the picture on the right (AQI readings), it gets slightly more complex since there are different kind of AQI scales all over the world.
The World Health Organisation (W.H.O.) is offering air quality guidelines based on reviews of the accumulated scientific evidences.
But almost each country is having its own scale, and this is also the case for China, which is using the scale known as HJ 633-2012. The one in use on the World Air Quality Index project is the US EPA scale. But, since graphics are better than many words, here are the two scales for the PM2.5 pollutant.
The most important is to notice that for AQI of 200 and above, the two scales are having the same breakpoints. So, next time, when checking Air Quality data provided on other websites, always carefully check the unit for the data, and make sure to double check which AQI scale is in use.
In the second part of this article, we will be writing about other scales used in the world, and there will be some very interesting surprise, like for instance the AQI scale used for Ulanbaataar and its 100-250 Low pollution range...
--
For more information about specific countries or continent, please refer to those articles: Thailand and Malysia - India - China - Hong Kong / Canada (Air Quality Health Index) - South America - Australia - Quebec and Montreal - Singapore - Poland - Indonesia .
For information about the 24 hours averaging used or Ozone and Particulate Matter (PM2.5), please refer to those two articles: Ground Ozone Index - PM2.5 Instant Cast

