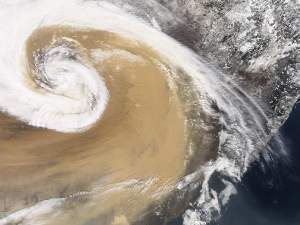
Kami telah beberapa kali menulis tentang pengaruh angin terhadap polusi udara, dan bagaimana angin kencang (atau, lebih tepatnya, ventilasi yang kuat) dapat membantu membersihkan udara dalam waktu yang sangat singkat. Namun kami tidak pernah berkesempatan untuk menciptakan visualisasi dinamis dari fenomena ini, sehingga artikel kali ini akan membahasnya.
--
Dalam hal perkiraan Kualitas Udara, kunci untuk mendapatkan akurasi yang lebih baik adalah menyempurnakan model perkiraan, dan membuat modelisasi spesifik untuk setiap negara, dan, bahkan lebih baik lagi, untuk setiap kota. Misalnya, di Beijing, kedekatan pegunungan di Utara dan Hebei di selatanlah yang menentukan modelnya:
- Angin selatan cenderung meningkatkan polusi di Beijing: Jika angin tidak cukup kuat (yaitu tidak cukup ventilasi ), maka partikel-partikel tersebut akan terhalang oleh pegunungan dan tidak akan mampu bergerak lebih jauh ke utara, sehingga menciptakan partikel yang padat. konsentrasi di Beijing.
- Angin utara cenderung menghilangkan polusi: Ketika angin bertiup cukup dari Utara, udara akan segera bersih karena tidak ada "sumber polusi" di utara (atau, setidaknya, jauh lebih sedikit dibandingkan di selatan).
Hal ini terlihat pada animasi di bawah ini, dimana sumber pencemaran ditempatkan secara sembarang di lokasi stasiun pemantauan berada di hebei. Setiap sumber polusi mengeluarkan satu partikel setiap jamnya. Semakin banyak jumlah partikel dalam suatu zona, semakin tinggi polusinya (biru berarti konsentrasi rendah, merah ~ coklat berarti konsentrasi tinggi). Model angin didasarkan pada Global Forecast System (alias GFS).
--
version 1.2 (2016/2/18)
--
Tentu saja ini merupakan model yang sangat ringan dibandingkan dengan model kompleks yang memerlukan kekuatan pemrosesan komputer super untuk dapat menghitung prakiraan kualitas udara seluruh dunia. Namun keuntungannya adalah menjelaskan secara visual konsep dasar di balik perkiraan kualitas udara.
Untuk lebih tepatnya, model harus mencakup profil angin vertikal, serta prakiraan untuk beberapa ketinggian (lapisan) - saat ini model hanya menggunakan prakiraan pada ketinggian 10 meter, 100 meter, dan 5KM. Selain itu, sumber polusi harus lebih lengkap dan mencakup sumber polusi dunia secara keseluruhan - saat ini, hanya sumber dari Hebei yang disertakan.
--
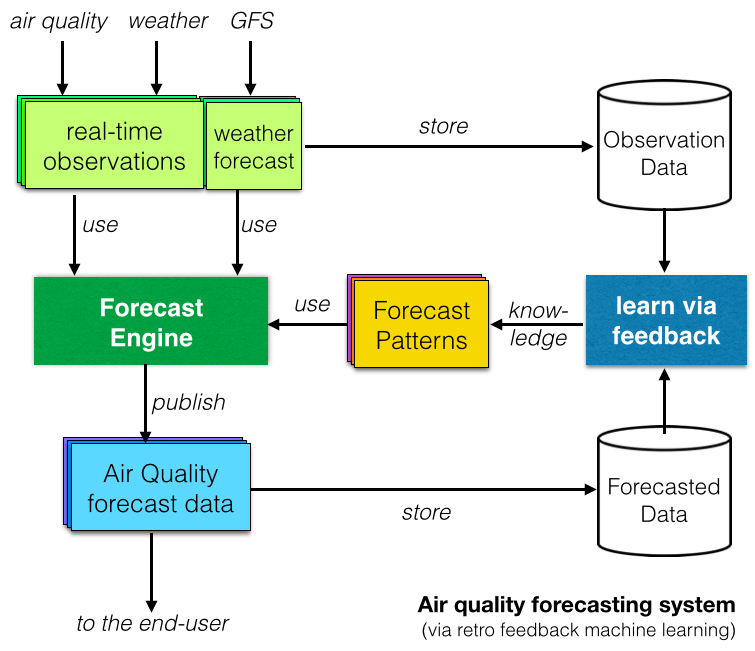
Terakhir, banyak laporan penelitian telah menyelidiki sistem perkiraan Kualitas Udara berbasis Pembelajaran Mesin atau Kecerdasan Buatan . Konsep dibaliknya adalah “belajar” dengan membandingkan data observasi dengan data perkiraan dan mengidentifikasi pola berulang (seperti yang ditunjukkan pada diagram di sebelah kanan).
Di atas kertas, sistem perkiraan berbasis Pembelajaran Mesin terlihat bagus, namun kenyataannya, apakah sistem tersebut lebih baik daripada model deterministik tradisional (yang kami sukai di proyek Indeks Kualitas Udara Dunia )? Merujuk pada pembicaraan TED yang luar biasa dari Talithia Williams tentang 'Miliki data tubuh Anda', jawaban kami terhadap pertanyaan ini adalah "tunjukkan kami datanya!", dan itulah yang akan kami tulis di artikel berikutnya tentang peramalan!
