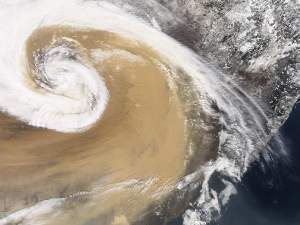
Rüzgarın hava kirliliği üzerindeki etkisi ve güçlü rüzgarların (veya daha doğrusu güçlü havalandırmanın ) havayı çok kısa sürede temizlemeye nasıl yardımcı olabileceği hakkında pek çok kez yazdık. Ancak bu fenomenin dinamik bir görselleştirmesini yaratma fırsatımız hiç olmadı, bu yüzden bu makale bunun hakkında yazacak.
--
Hava Kalitesi tahmini söz konusu olduğunda, daha iyi bir doğruluğun anahtarı, tahmin modelini iyileştirmek ve her ülke için, hatta her şehir için daha da iyi bir spesifik modelleme oluşturmaktır. Örneğin Pekin'de modeli tanımlayan şey, kuzeydeki dağların ve güneydeki Hebei'nin yakınlığıdır:
- Güney rüzgarı Pekin'deki kirliliği artırma eğilimindedir: Rüzgar yeterince güçlü değilse (yani yeterince havalandırmazsa ), parçacıklar dağlar tarafından engellenecek ve kuzeye doğru daha fazla hareket edemeyecek, dolayısıyla yoğun bir parçacık oluşacaktır. Pekin'de yoğunlaşma.
- Kuzey rüzgarı kirliliği temizleme eğilimindedir: Rüzgar kuzeyden yeterince estiğinde, kuzeyde herhangi bir "kirlilik kaynağı" olmadığından (veya en azından güneye göre çok daha az) hava neredeyse anında temizlenir.
Hebei'de izleme istasyonlarının bulunduğu yerde kirlilik kaynaklarının keyfi olarak konumlandırıldığı aşağıdaki animasyonda görülebilecek şey budur. Her kirlilik kaynağı saatte bir parçacık yayar. Bir bölgedeki parçacık sayısı ne kadar fazlaysa kirlilik de o kadar yüksek olur (mavi düşük konsantrasyona, kırmızı ~ kahverengi ise yüksek konsantrasyona karşılık gelir). Rüzgar modeli Küresel Tahmin Sistemine (diğer adıyla GFS) dayanmaktadır.
--
version 1.2 (2016/2/18)
--
Bu elbette tüm dünya hava kalitesi tahminini hesaplayabilmek için süper bilgisayar işlem gücü gerektiren karmaşık modellerle karşılaştırıldığında çok hafif bir modeldir. Ancak hava kalitesi tahmininin ardındaki temel konsepti görsel olarak açıklama avantajına sahiptir.
Daha kesin olmak gerekirse, model dikey rüzgar profilinin yanı sıra çeşitli yüksekliklere (katmanlara) yönelik tahminleri de içermelidir - şu anda model yalnızca 10 metre, 100 metre ve 5KM'deki tahminleri kullanıyor. Üstelik kirlilik kaynakları daha eksiksiz olmalı ve genel dünya kaynaklarını kapsamalıdır; şu anda yalnızca Hebei'den gelen kaynaklar dahil edilmiştir.
--
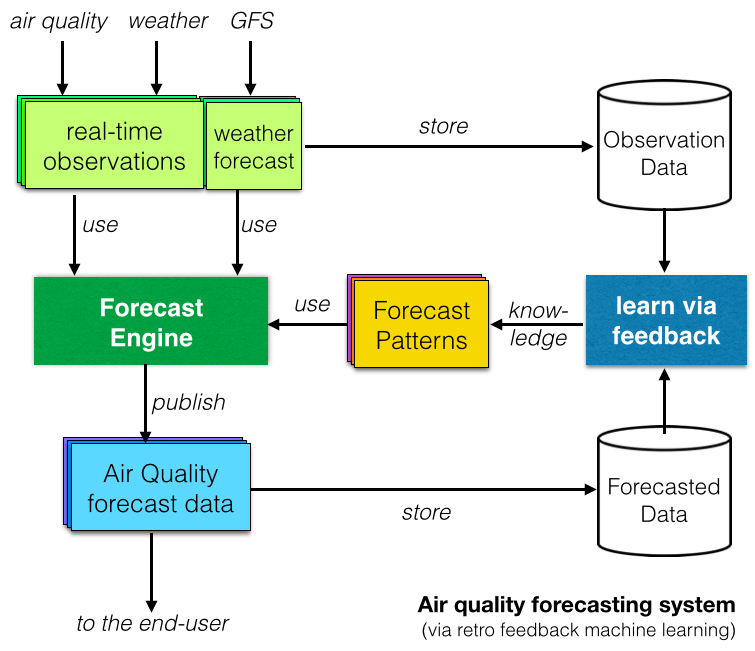
Son olarak, birçok araştırma raporunda Makine Öğrenimi veya Yapay Zeka tabanlı Hava Kalitesi tahmin sistemleri araştırılmıştır. Arkasındaki kavram, gözlemlenen verileri tahmin edilen verilerle karşılaştırarak "öğrenmek" ve tekrarlanan kalıpları belirlemektir (sağdaki diyagramda gösterildiği gibi).
Kağıt üzerinde Makine Öğrenimi tabanlı tahmin sistemi iyi görünüyor, ancak gerçekte geleneksel deterministik modellerden ( Dünya Hava Kalitesi Endeksi projesinde tercih ettiğimiz) daha iyiler mi? Talithia Williams'ın 'Vücudunuzun verilerine sahip olun' konulu mükemmel TED konuşmasına atıfta bulunarak, bu soruya cevabımız "bize verileri gösterin!" ve bu, tahmin üzerine bir sonraki makalemizde yazacağımız bir konu!

