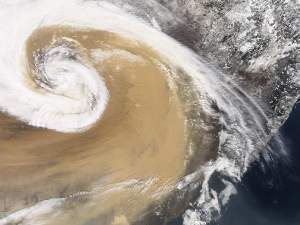
We have been writing quite a few times about the influence of wind on air pollution, and how strong winds (or, to be more precise, strong ventilation) can help to clean the air in a very short time. But we never had the opportunity to create on a dynamic visualization of this phenomenon, so this is what this article will be writing about.
--
When it comes to Air Quality forecasting, the key to a better accuracy is refined the forecasting model, and create a specific modelisation for each country, and, even better, for each city. For instance, in Beijing, it is the proximity of the mountains in the North and Hebei in the south which defines the model:
- South wind tend to increase the pollution in Beijing: If the wind is not strong enough (i.e. not ventilating enough), then the particles will get blocked by the mountains and will not be able to move further to the north, thus creating a dense particule concentration in Beijing.
- North wind tend to clear the pollution: When the wind blows sufficiently from the North, the air gets almost immediately cleared since there is no "pollution source" in the north (or, at least, much less than in the south).
This is what one can see in the animation below, in which the pollution sources are arbitrarilly located where the monitoring stations are located in hebei. Each pollution source in emitting one particle every hour. The more the number of particles in a zone, the higher the pollution (blue corresponds to low concentration, red ~ brown to high concentrations). The wind model is based on the Global Forecast System (aka GFS).
--
version 1.2 (2016/2/18)
--
This is of course a very light model compared to the complex models which do require super computer processing power to be able to compute the whole world air quality forecast. But it has the advantage of visually explaining the basic concept behind air quality forecasting.
To be more precise, the model should include vertical wind profile, as well as the forecasting for several heights (layers) - currently, the model is only using the forecast at 10 meters, 100 meters and 5KM. Moreover, the pollution sources should be more complete and include the overall world sources - currently, only sources from Hebei are included.
--
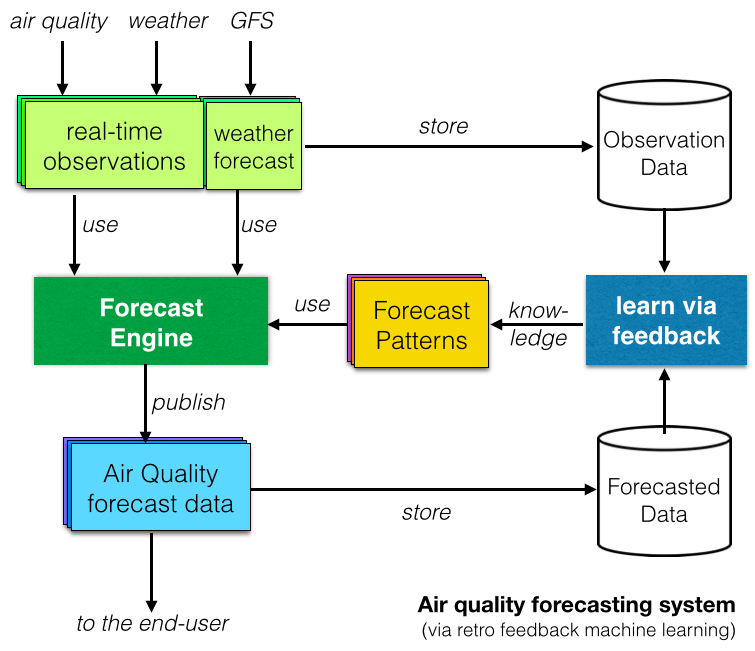
Last, many research reports have investigated Machine Learning or Artificial Intelligence based Air Quality forecast systems. The concept behind is to "learn" by comparing the observed data with the forecasted data and identify repetitive patterns (as shown on the diagram on the right).
On the paper, Machine Learning based forecasting system look good, but in actual fact, are they any better than the tradtional deterministic models (which we do prefer at the World Air Quality Index project)? Refering to the excellent TED talk from Talithia Williams on 'Own your body's data', our answer to this question is "show us the data!", and that's something we will be writing about in our next article on forecasting!

