لقد كتبنا عدة مرات عن تأثير الرياح على تلوث الهواء، وكيف يمكن للرياح القوية (أو، بشكل أكثر دقة، التهوية القوية) أن تساعد في تنظيف الهواء في وقت قصير جدًا. لكن لم تتح لنا الفرصة أبدًا لإنشاء تصور ديناميكي لهذه الظاهرة، لذلك هذا ما سنكتب عنه في هذه المقالة.
--
عندما يتعلق الأمر بالتنبؤ بجودة الهواء، فإن مفتاح الدقة الأفضل هو تحسين نموذج التنبؤ، وإنشاء نموذج محدد لكل بلد، بل وأفضل من ذلك، لكل مدينة. على سبيل المثال، في بكين، فإن قرب الجبال في الشمال وخبي في الجنوب هو الذي يحدد النموذج:
- تميل الرياح الجنوبية إلى زيادة التلوث في بكين: إذا لم تكن الرياح قوية بما فيه الكفاية (أي ليست جيدة التهوية بشكل كافٍ)، فسوف تحجب الجبال الجسيمات ولن تتمكن من التحرك أبعد نحو الشمال، مما يؤدي إلى إنشاء جسيمات كثيفة. التركيز في بكين.
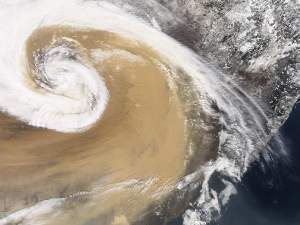
- تميل الرياح الشمالية إلى إزالة التلوث: عندما تهب الرياح بشكل كافٍ من الشمال، يتم تنقية الهواء على الفور تقريبًا نظرًا لعدم وجود "مصدر تلوث" في الشمال (أو على الأقل أقل بكثير مما هو عليه في الجنوب).
هذا ما يمكن رؤيته في الرسم المتحرك أدناه، حيث يتم تحديد مواقع مصادر التلوث بشكل عشوائي حيث تقع محطات المراقبة في مقاطعة خبي. كل مصدر تلوث ينبعث منه جسيم واحد كل ساعة. كلما زاد عدد الجزيئات في منطقة ما، زاد التلوث (اللون الأزرق يمثل تركيزًا منخفضًا، والأحمر ~ البني يمثل تركيزات عالية). يعتمد نموذج الرياح على نظام التنبؤ العالمي (المعروف أيضًا باسم GFS).
--
version 1.2 (2016/2/18)
--
يعد هذا بالطبع نموذجًا خفيفًا جدًا مقارنة بالنماذج المعقدة التي تتطلب قوة معالجة حاسوبية فائقة لتتمكن من حساب توقعات جودة الهواء العالمية بأكملها. ولكنها تتمتع بميزة الشرح البصري للمفهوم الأساسي الكامن وراء التنبؤ بجودة الهواء.
لكي نكون أكثر دقة، يجب أن يتضمن النموذج ملف تعريف الرياح الرأسية، بالإضافة إلى التنبؤ لعدة ارتفاعات (طبقات) - حاليًا، يستخدم النموذج فقط التوقعات عند 10 أمتار و100 متر و5 كيلومترات. علاوة على ذلك، ينبغي أن تكون مصادر التلوث أكثر اكتمالا وتشمل المصادر العالمية الشاملة - حاليا، يتم تضمين المصادر من خبي فقط.
--
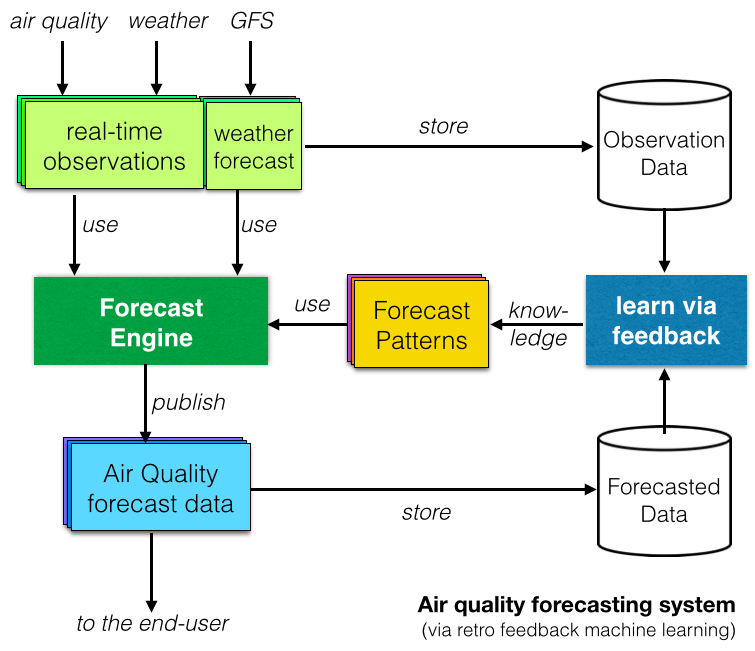
أخيرًا، قامت العديد من التقارير البحثية بالتحقيق في أنظمة التنبؤ بجودة الهواء القائمة على التعلم الآلي أو الذكاء الاصطناعي . المفهوم الكامن وراء ذلك هو "التعلم" من خلال مقارنة البيانات المرصودة مع البيانات المتوقعة وتحديد الأنماط المتكررة (كما هو موضح في الرسم البياني على اليمين).
على الورق، يبدو نظام التنبؤ القائم على التعلم الآلي جيدًا، ولكن في الواقع، هل هم أفضل من النماذج الحتمية التقليدية (التي نفضلها في مشروع مؤشر جودة الهواء العالمي )؟ بالإشارة إلى محاضرة TED الممتازة التي ألقتها تاليثيا ويليامز حول "امتلك بيانات جسمك"، فإن إجابتنا على هذا السؤال هي "أظهر لنا البيانات!"، وهذا شيء سنكتب عنه في مقالتنا التالية حول التنبؤ!
