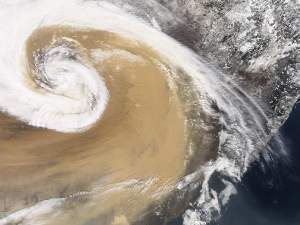
O wpływie wiatru na zanieczyszczenie powietrza i o tym, jak silny wiatr (a ściślej mówiąc silna wentylacja ) może w krótkim czasie pomóc oczyścić powietrze, pisaliśmy już nie raz. Nigdy jednak nie mieliśmy okazji stworzyć na dynamicznej wizualizacji tego zjawiska, dlatego właśnie o tym będziemy pisać w tym artykule.
--
Jeśli chodzi o prognozowanie jakości powietrza, kluczem do większej dokładności jest udoskonalenie modelu prognozowania i stworzenie specyficznego modelowania dla każdego kraju, a jeszcze lepiej dla każdego miasta. Na przykład w Pekinie bliskość gór na północy i Hebei na południu definiuje model:
- Wiatr południowy zwiększa zanieczyszczenie w Pekinie: jeśli wiatr nie jest wystarczająco silny (tj. nie zapewnia wystarczającej wentylacji ), cząsteczki zostaną zablokowane przez góry i nie będą mogły przemieszczać się dalej na północ, tworząc w ten sposób gęstą cząstkę koncentracja w Pekinie.
- Wiatr północny ma tendencję do usuwania zanieczyszczeń: Kiedy wiatr wieje dostatecznie z północy, powietrze zostaje niemal natychmiast oczyszczone, ponieważ na północy nie ma „źródła zanieczyszczeń” (a przynajmniej znacznie mniej niż na południu).
To widać na poniższej animacji, na której źródła zanieczyszczeń są dowolnie rozmieszczane tam, gdzie w Hebei zlokalizowane są stacje monitorujące. Każde źródło zanieczyszczeń emituje jedną cząsteczkę co godzinę. Im większa liczba cząstek w strefie, tym większe zanieczyszczenie (kolor niebieski odpowiada niskiemu stężeniu, czerwony ~ brązowy wysokiemu stężeniu). Model wiatru oparty jest na Global Forecast System (znanym również jako GFS).
--
version 1.2 (2016/2/18)
--
Jest to oczywiście bardzo lekki model w porównaniu ze złożonymi modelami, które wymagają mocy obliczeniowej superkomputera, aby móc obliczyć prognozę jakości powietrza dla całego świata. Ma jednak tę zaletę, że wizualnie wyjaśnia podstawową koncepcję prognozowania jakości powietrza.
Aby być bardziej precyzyjnym, model powinien uwzględniać pionowy profil wiatru, a także prognozę dla kilku wysokości (warstw) - obecnie model wykorzystuje tylko prognozę dla 10 metrów, 100 metrów i 5KM. Co więcej, źródła zanieczyszczeń powinny być pełniejsze i obejmować źródła światowe – obecnie uwzględniane są jedynie źródła z Hebei.
--
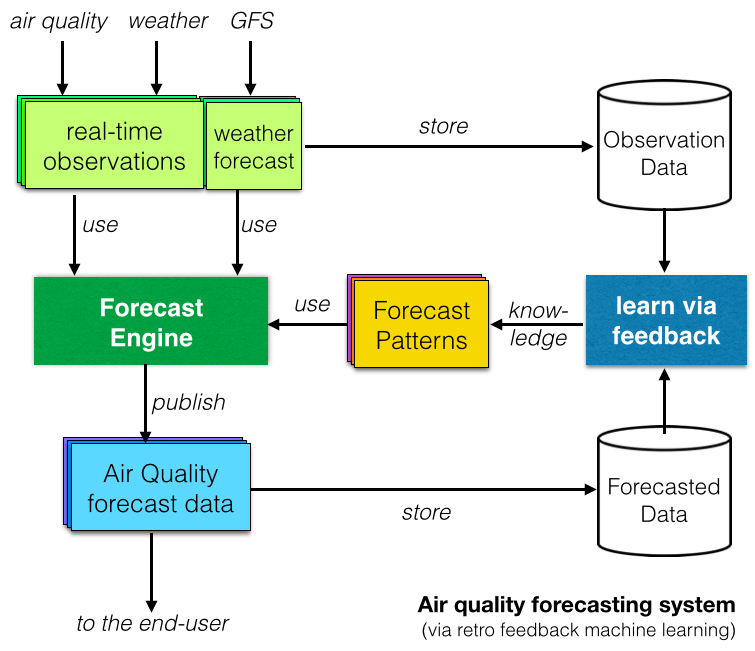
Wreszcie, w wielu raportach badawczych analizowano systemy prognozowania jakości powietrza oparte na uczeniu maszynowym lub sztucznej inteligencji . Koncepcja polega na „uczeniu się” poprzez porównywanie zaobserwowanych danych z danymi prognozowanymi i identyfikowanie powtarzających się wzorców (jak pokazano na diagramie po prawej stronie).
Na papierze systemy prognozowania oparte na uczeniu maszynowym wyglądają dobrze, ale czy w rzeczywistości są lepsze od tradycyjnych modeli deterministycznych (które wolimy w projekcie Światowego Indeksu Jakości Powietrza )? Nawiązując do znakomitego wystąpienia Talithii Williams na konferencji TED na temat „Posiadaj dane swojego ciała”, nasza odpowiedź na to pytanie brzmi: „pokaż nam dane!” i o tym będziemy pisać w następnym artykule na temat prognozowania!

