我们最近有幸与NASA 遥感监测项目开始合作。
目标是使用基于 NASA 卫星的远程空气质量传感来确定传感器不可用的区域的空气质量(例如海上,以及尚不可用传感器的国家/地区)。
乍一看,处理这些海量数据所需的远程卫星传感理论和算法对于非科学家来说似乎有点野蛮,例如必须处理气溶胶光学深度(又名AOD)和气溶胶光学厚度等数据集(又名AOT)。但实际上,美国宇航局在使数据易于任何人使用和理解方面做得非常出色,而且还可以免费提供(在公共领域)!
我们将撰写许多关于卫星数据的使用以及我们与 NASA ARSET 计划的合作的主题。但首先,我们想介绍他们的一款产品,叫做世界观,它使用起来非常简单直观,非常值得每个人都了解。世界观的一个非常好的功能是能够提供历史视图,这样你就可以检查过去几年中任何一天的数据(而且,还是免费的)。
下图拍摄于 1 月 14 日,显示了Modis Aqua层以及火异常和热异常(绘制为红点)。对于离开新加坡的人来说,这种观点可能很常见,因为新加坡环保局正在提供卫星热点监测,特别是监测来自印度尼西亚的火灾。
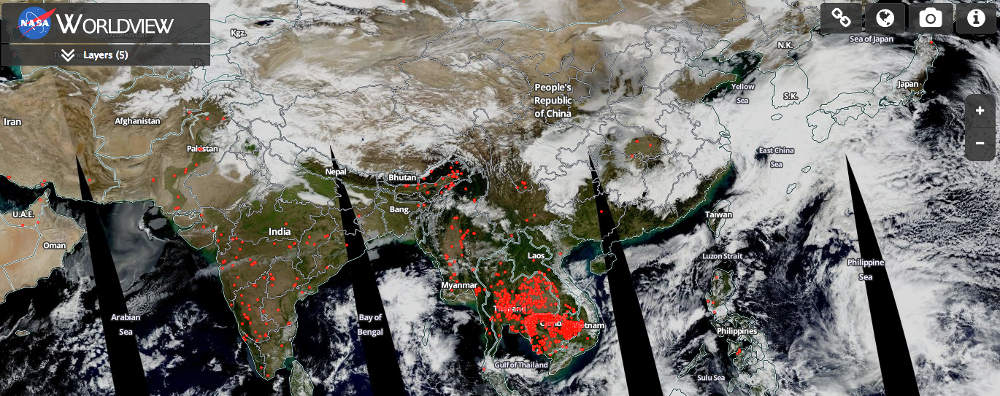
NASA 世界观服务器提供相同的图像:https://earthdata.nasa.gov/labs/worldview/
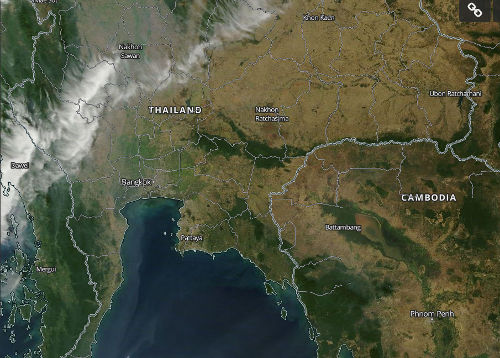
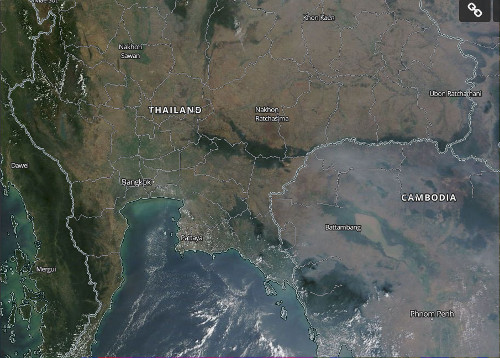
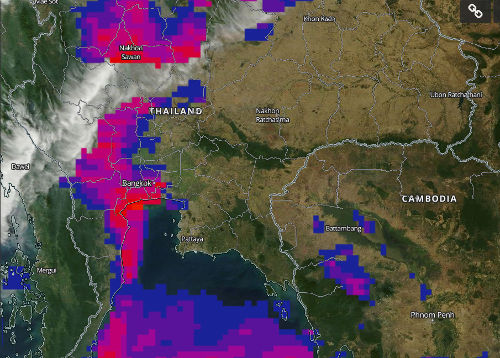
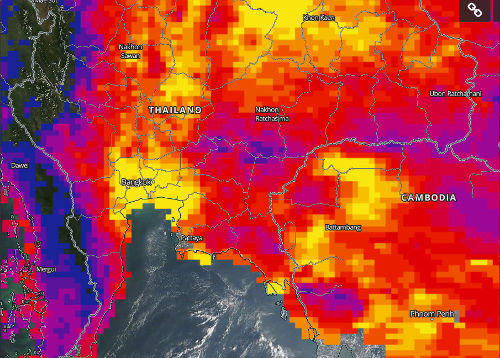
这是另一组快照,展示了泰国和柬埔寨两天的对比。一张天空几乎晴朗(左侧),另一张则有明显的雾霾(右侧)。通过使用气溶胶光学深度(AOD) 叠加(底部的快照),检测到最模糊的区域会以红色到黄色突出显示。比较顶部和底部快照,毫无疑问,使用 AOD 来检测污染,从而确定空气中 PM 2.5的数量是正确的方法。我们很快就会写到这一点。
| | |
 |  |
| | |
 |  |
请注意,看起来像雾霾的东西并不总是颗粒物——PM2.5污染。雾霾可以是烟雾、灰尘和污染的混合体。在某些情况下(请参阅本文)也可能是由于湿度造成的。
卫星数据的一个局限性是它只能每天提供(而不是每小时一次的地面监测),并且它不适用于多云的天空(显然,卫星无法穿透云层,至少在一段时间内)阿夸和泰拉)。但即便如此,尽管有这些限制,它仍然是一个具有多种可能性的伟大工具:为没有传感器的国家提供数据,为全球和全球空气质量预报提供来源,......
