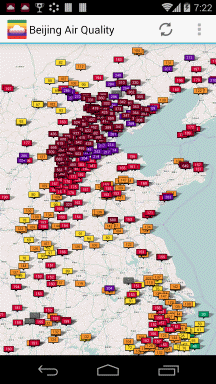
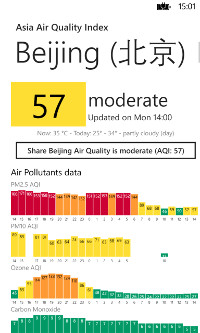
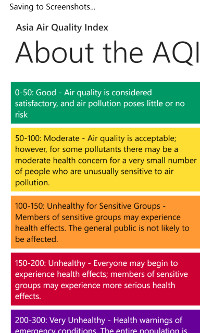
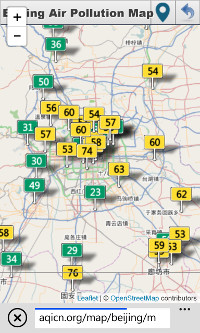
您想知道下面不同颜色和数字的含义吗?
这些数字是空气质量指数,范围从 0(好)到 500(差)。颜色对应于不同的健康影响类别(好、中等、不健康...危险)
(credits)
早在2008年,当世界空气质量项目启动时,所有现有的空气质量监测站都基于高度专业且昂贵的BAM和TOEM技术。此类工作站始终由专业且高素质的操作员维护 - 这确保了该工作站的输出值得信赖。
12 年后,BAM 和 TOEM 站仍然存在。但随着激光散射技术和低成本灰尘传感器的发展,BAM 和 TOEM 站的数量现在已经被巨大而密集的低成本传感器网络所取代。如今,此类网络非常多,仅举几例:urad、luft-daten、airqo、airbg、opensense、yakkaw、econet、airkaz、ccdc、ambente、green air 等。
Univ. of Arizona (credits)
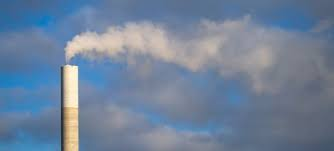
一个常见的问题是为什么二氧化氮 (NO 2 )、二氧化硫 (SO 2 ) 和一氧化碳 (CO) 浓度总是如此低,测量它们有用吗?
为了强调监测这些物质的重要性,本文将解释这些污染物从何而来以及它们如何影响我们的健康和环境。
为了简单起见,本文将只关注 NO2。
Univ. of Arizona (credits)
美国环保署更新臭氧8小时断点AQI标准已有几个月 。这绝对是加强美国空气质量的积极一步,因为与印度、中国或欧洲的类似标准相比,美国 EPA 标准实际上是最不保守的臭氧标准之一!
但更有趣的是, AirNow最近更进一步,引入了 Ozone NowCast公式,该公式允许使用加权 8 小时断点标准代替 1 小时断点。 AirNow 团队并未向公众广泛传达这一变化,但它对臭氧 AQI 的报告方式产生了相当大的变化,这就是我们将在本文中讨论的内容。

在过去的几个月里,世界空气质量团队一直致力于分析几个新的空气质量预测模型,并改进空气质量预测模型演示器。
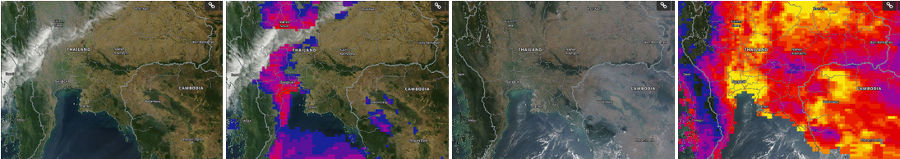
本文将介绍基于世界网格人口 ( GPW ) 的最新预测模型演示器,该模型将用于分析印度北部地区(包括孟加拉国、巴基斯坦和尼泊尔)的空气质量预测。
我们已经写过好几次关于风对空气污染的影响,以及强风(或者更准确地说,强通风)如何有助于在很短的时间内净化空气。但我们从未有机会创建这种现象的动态可视化,所以这就是本文将要写的内容。
近两个月以来,我们环境署的同事一直在采取一项有趣的举措,以宣传空气质量与联合国内任何其他业务一样重要的理念。他们开始在这个领域进行投资,并提出了一个出色的举措,即为负担得起的空气质量监测站创建一个开放的足迹。
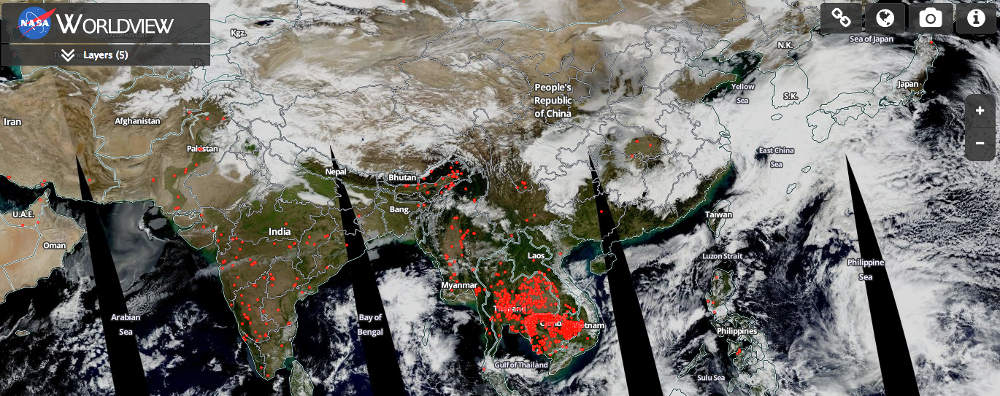
这是世界空气质量指数项目在南亚雾霾严重期间向 ASMC - 东盟专业气象中心 ( asmc.asean.org ) 做出的小小的贡献。
我们最近与世界各地更多的 EPA(环境保护机构)合作。在我们收到的所有请求中,实际上是提供网络地图服务,以便环保局自己可以将实时空气质量数据从其网站添加到地图上。
使用我们提供的此类地图网络服务的明显优势之一是受益于我们正在整理的跨境数据,即提供不受国界限制的全球空气质量信息。
第二个优势不仅在于这是一项免费服务,而且还与 google、bing 或 leaflet 的标准地图技术完全兼容,从而可以快速轻松地与任何现有网站集成。
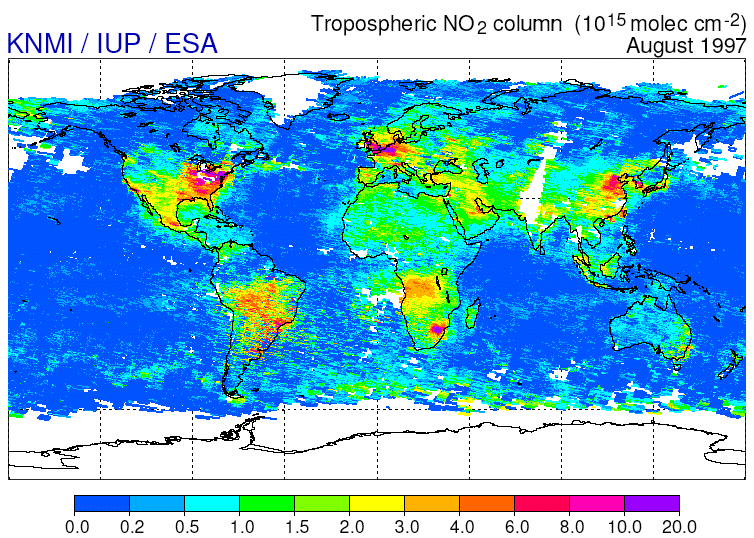
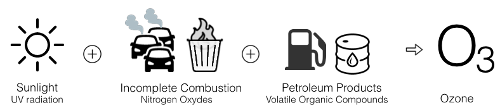
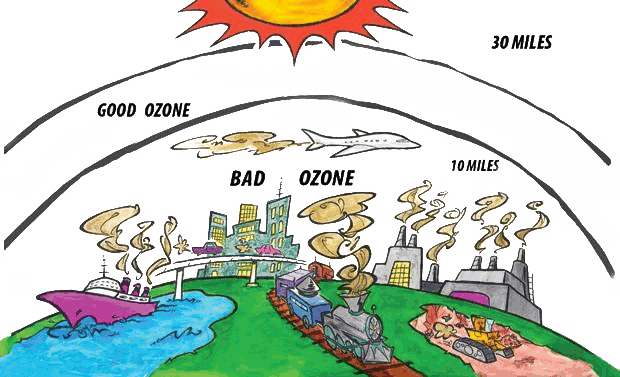
环境臭氧,称为 O 3 ,也称为地面或对流层臭氧,影响地球上的每个人,无论哪个国家,如右图所示 。
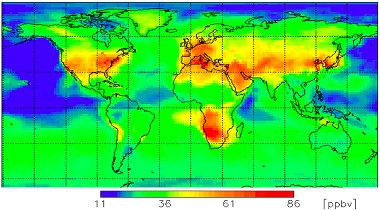
(Attribution: WMO GAW research on reactive gases )
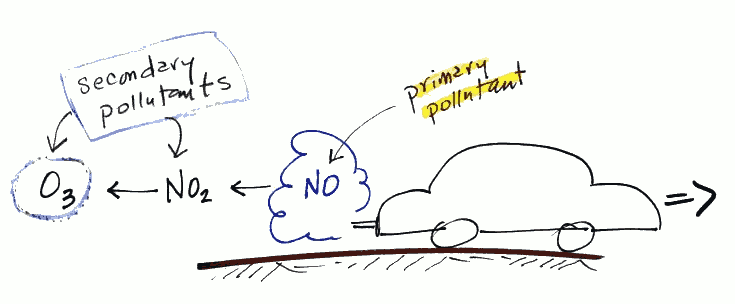
与颗粒物 (PM 2.5 ) 不同,地面臭氧不直接排放。相反,它是通过在氮氧化物、挥发性有机化合物、阳光和高温存在下发生的一系列化学反应产生的,如下图所示:
通过每个国家定义的空气质量指数标准来量化地面臭氧对健康的影响。有趣的是,世界上一半的国家使用基于毫克的测量标准,而其余的国家则使用基于 ppb 的测量标准。但这真的是个问题吗?这就是我们将在本文中讨论的内容。

Inspekcja Ochrony Środowiska.
(Inspection of Environmental Protection)
波兰的空气质量数据已经提供了一段时间,但我们最近收到了一些关于Inspekcja Ochrony Środowiska使用的 AQI 等级(即环境保护的区域检查)的问题,以及它与世界空气使用的等级有何不同质量指标项目。其中一位来自 Sylwia,她问道:
我对所有这些数字感到困惑,为什么与华沙环保局网站上显示的数字有差异。
请您介绍一下华沙数据的来源以及您提供的数据的可靠性吗?
这实际上是一个非常好的问题,因为当涉及到数据时,没有人应该将数据视为“理所当然”(参考Talithia Williams的精彩TED 演讲“拥有你身体的数据”)。这也是世界空气质量指数项目存在的原因,即向大家解释如何理解空气污染背后的数字。
为了改善 AQI 小部件与外部网站的集成,我们开发了新的小部件 API 源。与现有的小部件提要相比,这个新的 API 提要为集成提供了更大的灵活性,而且还提供了更多用于自定义小部件外观的选项。
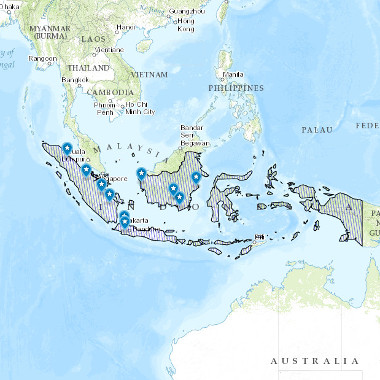
印度尼西亚现已提供实时空气质量数据。位于印度尼西亚主要城市的 10 个监测站正在实时测量 PM 10污染。
这些监测站由印度尼西亚气象、气候和地球物理部BMKG ( Badan Meteorologi Klimatologi dan Geofisika ) 运营。

蒙特利尔和魁北克的空气质量数据已经提供了一段时间,但我们最近收到了一些关于加拿大该地区使用的 AQI 等级的问题。其中一封来自 Marie A.,她问道:
我想知道为什么你们网站上的空气质量指数与蒙特利尔网站上的AQI不一样?您是否重新计算任何内容以满足 US EPA AQI 标准?如果是这样,怎么办?用什么数据?
这确实是一个非常好的问题。我们将在本文中解释所使用的不同比例、这些比例如何相互比较以及如何进行转换。

感谢世界空气质量指数项目社区,网站和网络应用程序现已提供波兰语翻译。非常感谢用户“ AiRs ”做出的杰出贡献。
Guagua Pichincha volcano in Ecuador (Attribution)
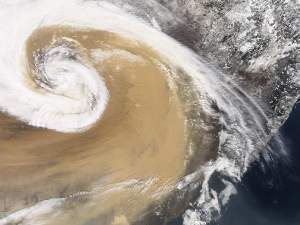
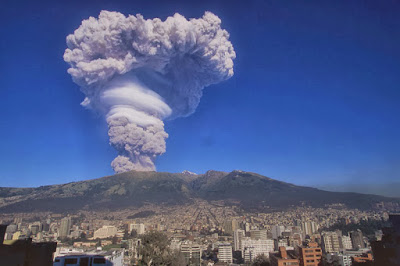
北京市民早就知道,净化空气污染的最佳自然方式是北风大风,而南风反而可能带来更多来自河北的污染。
在厄瓜多尔基多,也存在类似的问题,只不过污染来自于活火山。幸运的是,它们喷发的频率并不高,但当它们喷发时,最好避免处于爆炸性喷发形成的厚重火山灰云之下(见图)。
香港环保署将空气质量指数标准从传统的空气污染指数更新为所谓的空气质量健康指数(AQHI)已经有很长一段时间了,但我们直到现在才得到更深入的了解。它,我们将在本文中进行。
香港环保局实际上在解释空气质量健康指数的定义方面做得非常出色,人们可以从他们的网站上获得了解空气质量健康指数所需的信息。最明显的简化就是将传统的0-500指数改为新的简化的0-10 +范围,细分为5个健康风险类别,如下图:
| LOW | MODERATE | HIGH | VERY HIGH | SERIOUS | |||||||||||||||||
| | | | | 1 | 2 | 3 | 4 | 5 | 6 | 7 | 8 | 9 | 10 | 10+ | | ||||||
但实际上不仅仅是范围简化:新的 AQHI 还引入了非常巧妙的“增加健康风险” (%AR)概念,该概念最初由来自南非的四位合作伙伴组成的团队于 2007 年定义,并且首先在加拿大使用。
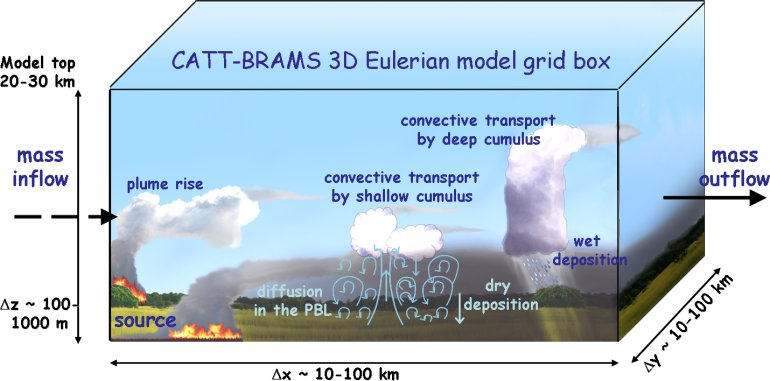
南美洲的空气质量预测现已在世界空气质量指数项目中提供,该项目与巴西气候预测中心 ( CPTEC )合作。可以从cptec.inpe.br以及Forecast/ South-america/免费访问该预报。
The CPTEC team has done an excellent work at providing a simple and detailed explanation on the underlying concepts used by their forecast model, called BRAMS (for Brazilian developments on the Regional Atmospheric Modelling System). The picture below (from the CPTEC) is giving an insight on the workflow for their model (source -> transport -> deposition).
(Attribution: Houston Clean Air Network )
地面臭氧空气质量指数计算刚刚更新,以遵循即时投射概念,即报告现在的污染,而不是前几个小时的污染。有关 Instant Cast 的更多信息,请参阅这篇文章。
臭氧指数的计算现在使用每小时读数,而不是之前的 8 小时平均值,但对于 AQI 低于 100 的情况,仍采用相同的 8 小时 AQI 断点公式。不使用之前计算 8 小时平均浓度的程序更多即时报告。 AQI 高于 100,则使用正常的 1 小时臭氧断点(而在此之前,AQI 高于 100 被定义为 1 小时和 8 小时读数的最大值)。

世界卫生组织发布《2014年城市环境(室外)空气污染数据库》已经一年多了。参与该项目的世卫组织团队在收集如此多国家的数据方面做得非常出色,并将所有数据集中在一个可供所有人访问的地方。
我们在过去的几篇文章中对此进行了介绍(例如非洲或拉丁美洲的空气质量),但我们从未有机会查看不同的选项来可视化其数据集。因此,这就是我们将在本文中讨论的内容。
(Tiranga, तिरंगा)
印度中央污染控制委员会最近宣布于 2015 年 4 月发布印度国家空气质量指数标准 ( NAQI )。有关该标准的所有详细信息均可从CPCB 、维基百科或坎普尔印度理工学院 ( iitk.ac.in ) 的这份报告中获得。
这实际上是空气质量世界意识向前迈出的非常重要的一步,因为每个国家的空气污染都因其国家污染类型而异:例如,由于灰尘(阿拉伯半岛),由于交通(新德里)或地形(智利)。
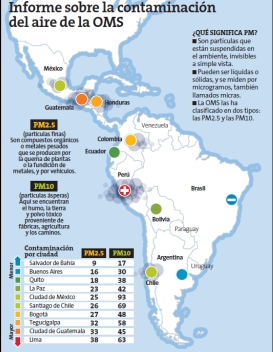
就像世界上任何其他大陆一样,拉丁美洲也面临着空气污染问题。世界卫生组织最近发布的 2014 年环境(室外)空气污染报告给出了拉丁美洲几个城市的一些年度平均数据。毫不奇怪,最糟糕的情况发生在亚洲,但拉丁美洲的一些城市也有很高的指数(见左表)。
然而,世界卫生组织的排名应该仔细考虑,特别是考虑到报告中使用的测量方法可能存在争议——例如,对于利马,秘鲁环保局认为世界卫生组织的数据不正确,因为样本不是在利马采集的。正确的地方(阅读P. Estupinya的这篇文章,了解来自多个国家的完整反馈)。实际上,出于这个原因,我们只发布有关世界空气质量项目的实时信息,因为我们确实相信,除了排名之外,当前的状况对世界公民来说也很重要。
(Jalur Gemilang)
马来西亚的空气质量已经提供很长时间了,但与其他国家不同的是,只提供综合 AQI。 PM 10 、臭氧等个别污染物的 AQI 无法获得,这使得转换为 US EPA 等级变得更加困难。
幸运的是,有关马来西亚使用的 AQI 等级(也称为 API(空气污染物指数))的信息在《马来西亚空气污染物指数指南》文件中有清楚的解释。
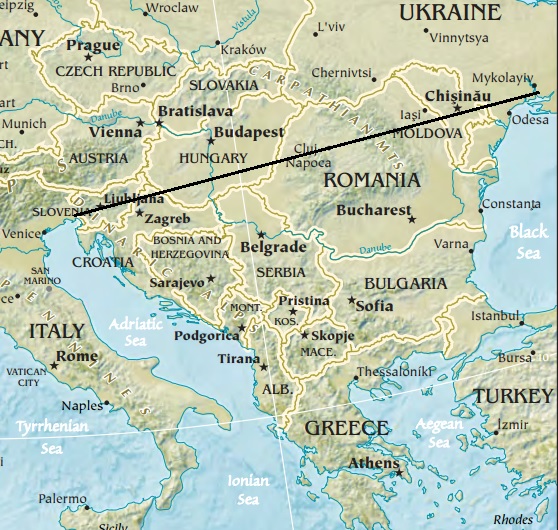
巴尔干半岛,俗称巴尔干半岛,是东南欧的一个地理区域。该地区得名于巴尔干山脉,从塞尔维亚东部一直延伸到保加利亚东部的黑海。
巴尔干地区的许多国家都提供实时空气质量读数。土耳其(色雷斯)、罗马尼亚和克罗地亚的数据早已在世界空气质量指数项目中提供。今天,我们能够推出 3 个新国家的数据:塞尔维亚、保加利亚和马其顿。

我们很荣幸受到 NASA 应用遥感培训 ( ARSET ) 团队的Pawan Gupta 博士的邀请,在地球观测和空气质量应用工具网络研讨会上介绍我们的世界空气质量指数项目:
当谈到空气质量时,人们首先想到的国家是中国和印度,更普遍的是亚洲。即使在世界空气质量指数项目中,亚洲从一开始就一直是我们的重点关注对象(很可能是因为这里是我们的总部所在地!)。
几年前,也就是2012年,我们决定将业务范围扩大到其他七大洲,首先是大洋洲,然后是欧洲以及北美、南美。
但七大洲之一的非洲却出奇地落后。我们收到了许多关于数据缺乏的询问,最后一个询问来自 Said E.,他写道:
感谢您创建世界空气质量指数项目网站。它提供了非常有用的信息。
我唯一担心的是为什么不考虑非洲。
仅供参考,我是摩洛哥公民。
")
STRONG LAPSE CONDITION (LOOPING)
")
WEAK LAPSE CONDITION (CONING)
")
INVERSION CONDITION (FANNING)
Examples of Atmospheric Stability (attribution)
在天气预报中,预测模型用于根据气候系统从初始状态随时间的变化情况来预测大气的未来状态。
虽然预测模型相当复杂(并且确实需要强大的科学和工程能力),但通过将实际经验观察结果与预测值进行比较来分析这些预测模型并验证其准确性的科学却非常简单。
对于空气质量领域,就像天气预报一样,可以定义用于预测未来大气污染的模型。实际上有很多这样的模型,通常称为大气扩散模型。就像天气预报一样,同样的精度分析概念也可以应用于大气污染预测。
我们经常收到用户询问世界空气质量指数项目上发布的数字,并想知道与其他网站上表达的值的差异。这实际上很正常,因为这些数字,也称为空气质量指数 (AQI),可能会让初学者感到非常困惑。我们收到的最后一条消息如下:
自去年以来,我们一直在检查中国天津的空气质量指数,但我们发现你们网站的数据与你们网站上公布的另一个官方网站(air.tjemc.org.cn)的数据有很大差异。我想知道哪一个可以提供更准确的数据,因为这会影响室外还是室内的决定。请帮我解决这个问题。谢谢你!
我们之前已经写过很多关于这个问题的文章,例如上海、新加坡 PSI 和 PM 2.5 AQI的 PM 2.5比较数据,以及最近的临近预报。
但是,由于我们仍然收到很多问题,我们现在撰写这篇文章来解释世界各地使用的 AQI 量表的差异。
早在 2015 年 3 月,我们就有机会在北京会见了来自美国国务院以及中国代表团(在北京美国大使馆运行 PM 2.5监测器的著名实体)的几位环境专家。
在所有讨论的主题中,有一个值得一写,即“即时广播”系统。美国 EPA 使用该系统将原始污染物读数(以 µg/m3 或ppb表示)转换为 AQI(范围从 0 到 500)。它用于airnow.gov网站上报告的所有 AQI 值。
临近预报背后的概念是补偿“ 24 小时平均值”,在将浓度转换为 AQI 时应使用该平均值。进行此平均的原因是, AQI 量表指定每个健康问题级别(即良好、中等、...不健康...)在 24 小时暴露条件下有效[1] 。例如,当看到188 AQI(不健康)时,需要将其解读为“如果我在外面呆了24小时,并且这24小时内AQI为188,那么对健康的影响就是不健康”。这与“如果现在报告的AQI是188,那么对健康的影响就是不健康”的说法有很大不同。
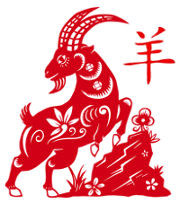
我们刚刚踏入农历羊年(结合 2015 年的木元素),对于世界空气质量指数项目团队来说,这意味着全速致力于将空气质量监测扩展到东南部新国家亚洲。即:菲律宾、柬埔寨和印度尼西亚(以及更多国家,例如缅甸和老挝,很快就会跟进)。
As there is also a huge demand for PM2.5 monitoring for Thailand (especially Chiang Mai and Bangkok), or for more station in Vietnam (Ho Chi Minh City), the extension will also cover selected countries with existing network.
但是,这一次,与之前的国家不同,我们确实需要每个人的帮助,特别是如果您居住在这些国家之一,请提供您的帮助。原因是,这一次,由于这些国家的环境保护机构(EPA)尚未公开实时空气质量信息,世界空气质量指数项目将开始众包主要城市的空气质量监测站上述国家1 .
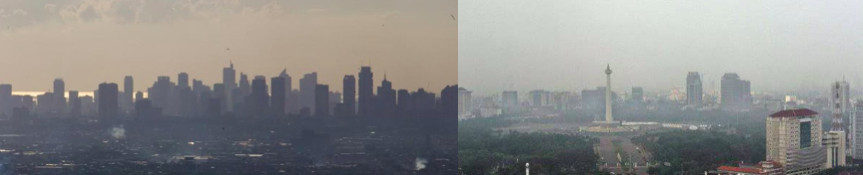
Visible Air Pollution on the Manilla and Jakarta Skylines
我们最近有幸与NASA 遥感监测项目开始合作。
目标是使用基于 NASA 卫星的远程空气质量传感来确定传感器不可用的区域的空气质量(例如海上,以及尚不可用传感器的国家/地区)。
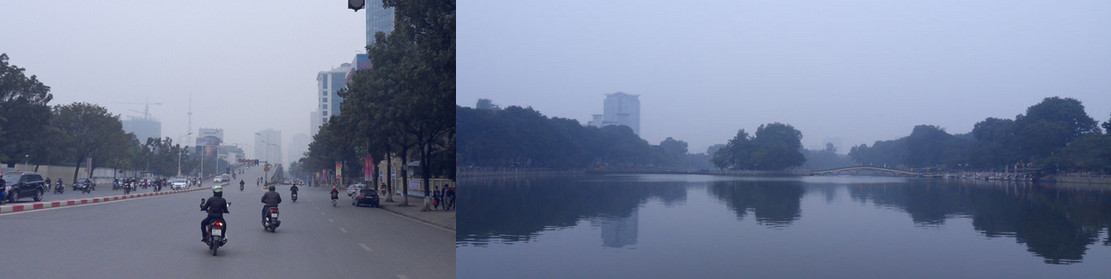
本周早些时候(2015 年 2 月),我们收到河内市民的一些询问,想了解河内页面(城市/越南/河内)上显示的空气质量指数。
询问的主要原因是世界空气质量指数项目上显示的空气质量指数约为50(绿色AQI)水平,而河内的室外能见度是这样的:


与 2002 年以来的每一年一样,我们来自亚洲清洁空气(又名清洁空气倡议)的同事正在组织两年一度的更好质量会议( baq2014est.org )。此次,它将于2014年11月19日至21日在斯里兰卡举行,并将与环境可持续交通(EST)论坛共同主办。
The "Integrated Conference of BAQ 2014 and Intergovernmental 8th Regional EST Forum in Asia" co-organized by the Ministry of Transport of Sri Lanka, The Ministry of Environment and Renewable Energy of Sri Lanka, Ministry of the Environment of Japan, United Nations Centre for Regional Development, and Clean Air Asia, in partnership with the Asian Development Bank, German International Cooperation (GIZ), and World Bank.
今年的主题是“清洁空气和可持续交通的下一代解决方案——迈向亚洲宜居社会”:
认识到清洁空气和可持续交通对于亚洲宜居社会至关重要,我们呼吁采取创新和明智的解决方案(政策、制度、技术和融资) ,以显着减少能源、工业、交通和地区来源的空气污染和温室气体,并通过加速亚洲城市和国家向环境可持续交通(EST)的转变,确保安全、公平、环境和人性化的交通系统。
查看该程序。预计将有超过 800 名参与者参加 2014 年 BAQ,我们将成为其中的一员,展示我们最近在我们的研究实验室中进行的有关经济实惠的空气质量监测解决方案的研究。
西澳大利亚州政府环境监管部 (DER) 现将数据发布在其网站上: der.wa.gov.au/your-environment/air 。
虽然到DEC 站点的链接仍然不起作用,但可以从这个新页面访问该提要。
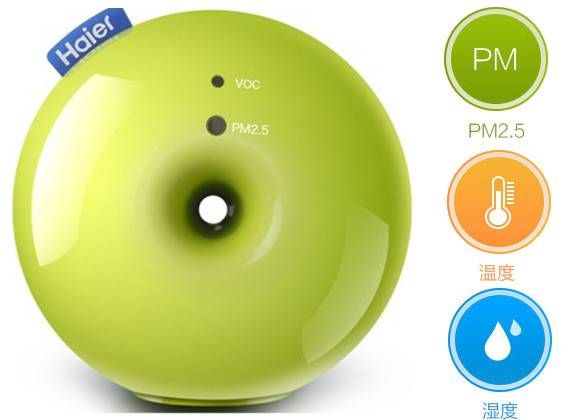
它声称能够同时测量挥发性有机化合物(VOC,即臭氧),和PM2.5颗粒物。 但是他的真实效果如何呢? 要知道答案,请查看我们的最新正在进行的实验有关海尔的AirBox连接: experiments/haier-air-box。
--
注:本文写于 2013 年。虽然 Dylos 显示器仍然是一个不错的产品,但现在有更好、更实惠的监控产品,所以我们不建议再购买 Dylos 产品。
例如,您可以查看 ES Labs 的GAIA 空气质量监测站产品系列。
Dylos的实验已经进行50天了。 上周末北京有很强的北风,空气污染降到很低,因此我们利用这个时间作为维护Dylos计数器的好机会
原因是,虽然Dylos 计数器是精心设计与制造的仪器(我们确实这样认为),但是它或许并不是专门为在北京有时会出现的严重空气污染情况下而设计的。
注意到在空气严重污染的情况下,dylos 与BAM 之间的相关图表读数在浓度超过38000以上的差距越来越大后,所以我们决定检查Dylos计数器内部的工作情况. 这种饱和现象是由于内部空气不能正常流通引起的严重结果,而空气不能正常流通是由于空气管道饱和后引起的。在空气严重污染的期间, 由于大量颗粒物通过空气管道形成的这种现象是完全正常的。
在打开Dylos检测器后,我们确认了内部空气通道在连续积累了五十天的灰尘后,确实已经饱和了。


- 北京的灰尘 可以影响 Dylos空气颗粒物 计数器 内部工作 -
照片上的灰尘就是这次清洁的结果。使用一个细小精致的刷子,就可以清理出如此数量惊人的灰尘。这是在室外做了五十天实验后的结果。 照片上的灰尘就是严重污染时空气中悬浮的可被吸入的颗粒物。

- 真实的北京灰尘,北京的人们在空气严重污染时所呼吸的。 -
我们应该知道即使是BAM这样精密昂贵的专业设备都需要技术人员进行每个月的维护。因此在我们看到Dylos清洁维护后的灰尘就不必那么吃惊了。
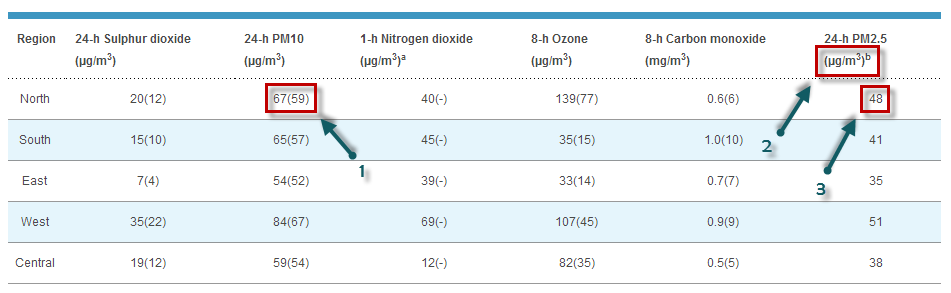
清洁维护已经过去10天了。从箭头2指示的部分,可以看出清洁前与清洁后Dylos 的读数数据与BAM的数据已经十分接近了。 尽管清洁维护确实起到了效果,但是在空气污染极其严重的情况下,这种差距还是会存在的(可以比较1与3 部分)。 我们会与Dylos公司联系,咨询他们对此种情况的解释与看法。
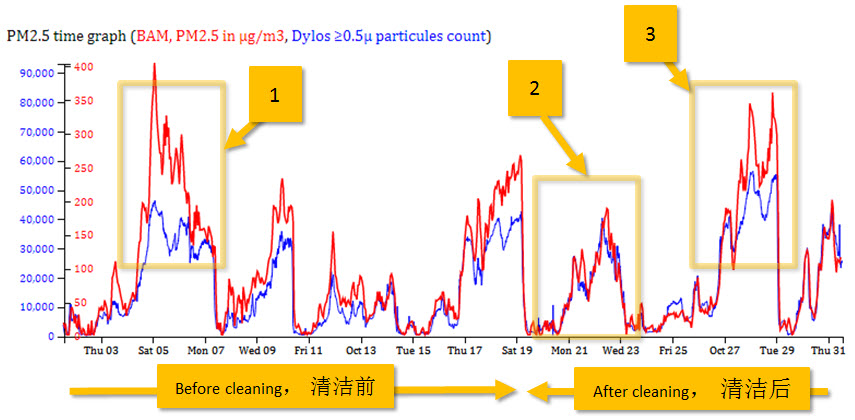
(点击照片可以打开全部的实时数据)
--
与(1999年发布的)前一版相比,2012年12月14日发布的新版EPA标准的主要变化是吧PM2.5空气质量指数的每个等级的15µg/m 3 降到了12µg/m3。
2013年9月9日以后,所有的 国家都使用更新后的PM2.5 空气质量换算数值范围,如表格所示:
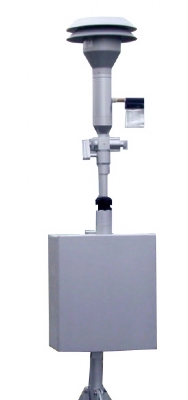
BAM的工作原理非常简单:它可以测量beta粒子(电子)穿不通过一层薄薄的悬浮微粒物质(PM)后减少的数量。随着PM层厚度的增加,能穿过的beta粒子数量越低。
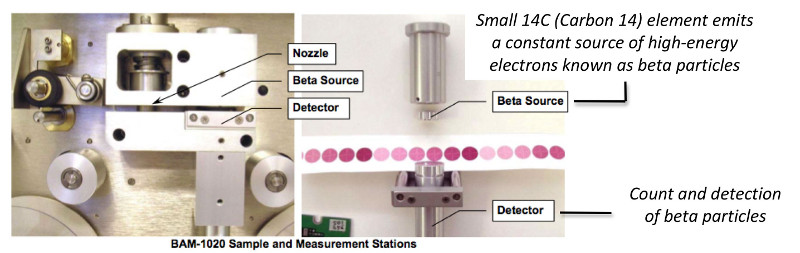
BAM仪器的唯一的主要问题就是它的价格。它的价格预计在12万人民币左右(1万5千欧元)。在中国,目前官方监测站大约有500个BAM仪器(平均每个城市 大约有10个监测站)。但是这些还不够,由于还有许多城市不能提供PM2.5读数。在泰国,有21个自动(提供每小时读数的)监测站, 但是却没有一个可以提供PM2.5数据的监测站。在越南,全国只有3个监测站。
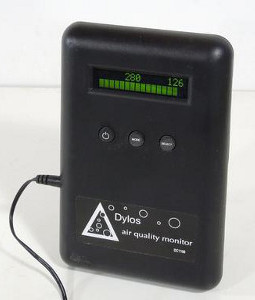
因此,在等待全世界各国政府过买更多最新的Beta 衰减检测器的时候,有没有别的事情可以做呢?答案是有的!事实上,有一种相对可负担得起的仪器可以用来检测空气质量中的PM10 和 PM2.5的数值。其中最有名的是Dylos空气微粒计数器(Dylos Air Particule counter):
如果你想了解更多有关Dylos空气微粒计数器的工作原理,请参考Matthias 在逆向工程方面杰出的研究,或者直接访问Dylos的网站(www.dylosproducts.com/). 您也可以参考resarch纸 “ A low-cost instrument for environmental particulate analysis based on optical scattering”来了解测量理论。
Note: this article was written in 2013. While the Dylos monitor is still a good product, there is nowdays much better and affordable monitoring products, so we do not recommend purchasing the Dylos product anymore. --
为了证明dylos仪器同样可以用来作为检测空气质量的仪器,我们在我们的实验室里用Dylos DC 1100 Pro, 带PC接口设置了一个实验。这个专业版的仪器可以在亚马逊上买到,价格是319美元 (1888人民币)。虽然相比之下Dylos DC 1100 较便宜些,但是需要注意的是必须要购买专业版的仪器 (Pro, 带PC接口),因为它提供一个电脑接口,可以强制自动提取数据。
如果你想在中国购买Dylos DC 1100 Pro, 带PC接口仪器,请确定你购买的正确的专业版仪器。目前,在京东上海没有找到出售专 业版仪器的卖家,在淘宝上只有几个卖家。如果你真的想尽快买到我们推荐的Dylos DC 1100 Pro, 带PC接口 专业版仪器,但是又不想等待到货时间,可以购买价格更贵的Dylos DC 1700,但是Dylos DC1700仅是做了一些简单的升级,并不会改变我们检测出的空气质量检测结果。
--
为了把自动提取的数据传输到服务器,还需要:Raspberry PI (278人民币) 和一个连接USB数据线(20人民币), 清单总计:2188人民币左右。
 |  |  |
| Dylos DC1100 pro with PC interface | Serial to USB cable | Raspberry PI |
The documentation and scripts for connecting the Dylos particules counter to the Raspberry PI, and automatically uploading the dylos data to the World Air Quality project server are available freely from github: github.com. If you have any questions, you can contact us with the subject "Dylos Experiment".
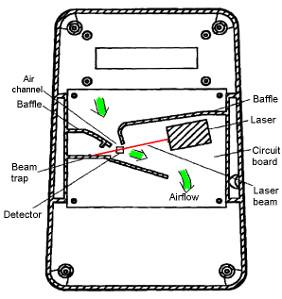
Also, please note that when you setup your Dylos Particule Counter outside, you need to be carefull where you locate it. Ideally, it should be in a place which is not too windy, as the wind can have a significant impact on the readings (The reason is that the Dylos counter is using a simple fan to get the air inflow, and the volume of air inflow per minute needs to be constant in order to have accurate readings ~ This simple fan is one of the reason why this kind of material is so affordable compared to the professional MetOne BAM sensors).
--
为了更好地比较Dylos与BAM两种仪器的读数,因为给我们提供Dylos数据的监测站在三里屯SOHO附近,因此,我们采用了朝阳区农业展览馆监测站提供的BAM数据。
这里是两种数据的实时结果:蓝色的数据线是Dylos的读数(每分钟更新),红色的数据线表示的是BAM的数据(每小时更新)。第一幅曲线图比较的是PM10的读数,第二幅图比较的是PM2.5的读数。

(点击照片可以打开全部的实时数据)
如图所见,Dylos与BAM读数间的相似度非常高,但也并不总是对得上的。在这篇文章的第二部分(将在两个后,收集到足够的数据后发表),我们将提供更多有 关读书的统计分析数据。
如果你有兴趣参加这个实验,建立你自己的Dylos监测站,请与我们联系。我们会为你提供所有的程序代码与设置 细节,安置你的数据库传感器,这样你就可以实时观测到你自己的读数了。
With the recent Southeast Asia Smog from Indonesia affecting Singapore and now Malaysia, we got many questions about why there is a difference between the data which can be read from Singapore NEA website (nea.gov.sg) and the World Air Quality Index project Singapore webpage.
例如,今天可以在 NEA 网站上看到以下内容:
以下表格概括了两种标准在各种语言间的不同指示。
| 空气质量指数范围 | 之前使用的中国环保局的指示 | 现用的美国环保署的AirNow 指示 | 之前的中文翻译 | 新的中文翻译 | 新的日文翻译 | 新的韩语翻译 | 新的俄语翻译 | 颜色代码 |
| 0-50 | Excellent | Good | 优秀 | 优 | 優 | 파랑 | Среднее | |
| 51-100 | Good | Moderate | 好 | 良 | 良 | 초록 | Неподходящее для особо восприимчивых | |
| 101-150 | Lightly Polluted | Unhealthy for Sensitive Groups | 微污染 | 轻度污染 | 軽微汚染 | 노랑 | Плохое | |
| 151-200 | Moderately Polluted | Unhealthy | 轻度污染 | 中度污染 | 軽度汚染 | 주황 | Нездоровое | |
| 201-300 | Heavily Polluted | Very Unhealthy | 中度污染, 重污染 | 中度污染 | 中度汚染 | 빨강 | Очень нездоровое | |
| 301-500 | Severely Polluted | Hazardous | 污染严重的 | 重度污染 | 重汚染 | 갈색 | Опасное |
请注意,这是本网站唯一更新过的指示。安卓应用的指示即将更新。
(翻译:Lynn)
(Click here for the english version )
实际上,这是一个非常好的问题!在北京,如果你不得不戴口罩,那么最好确保口罩真的可以过滤那些有害物质。 由于我没有答案来回答他的问题,我给新加坡totobobo口罩制造公司的Francis Chu 发了一封邮件,他马上给出了回答:
是的,我们的口罩能够降低99.85%的0.1微米的微粒。对于不熟悉微粒大小的读者来说,PM10 指的是小于10微米的颗粒物质,对于PM2.5来说,它指的是小于2.5微米的颗粒物质。 因此,过滤掉所有小于0.1微米的物质,意味着它可以过滤掉小于PM2.5 25倍的有害物质!所以,Klaus,不用担心,最新的技术肯定是有效的!
下载实验报告可访问链接: totobobo.com/download/F96-NelsonLab-test.pdf
有关颗粒大小的详细信息,可以参考维基百科网页。 如想获知更多空气过滤器如何实际测验的,或者如何比较各种口罩品牌,可以查看totobobo信息丰富的 博客条目。
如想购买此Totobobo口罩:
(翻译:Lynn)
(Click here for the english version )
我不明白为什么PM2.5 的浓度 经常比PM10 的高。SP的问题是完全正确的:PM2.5 用定义来解释,就是比2.5微米小的颗粒,所以它们确实应该被包括在比10微米小的颗粒里面。
比PM2.5小的不是包括在比PM10小的浓度里面吗?
非常感谢您的回答。
但是假设有关的浓度是不正确的:PM2.5的浓度可以比PM10的浓度小。然而,被修改过的值可以高一些。 举个例子,一个PM2.5的空气质量指数为50,它与每平方米15.5微克是一致的。然而,它与PM10的每立方米55微克也是一致的。
所以,即使PM2.5的每平方米15.5微克浓度全部被加进PM10的浓度里,PM10的空气质量指数依然保持比PM2.5的空气质量指数更低。 例如,本周早些时候,东城东四地区的PM10的浓度为366,空气质量指数的结果为216,可是,东城东四地区的PM2.5浓度为348,空气质量指数的结果为398.
为了双重确定我们的理解是对的,我们联系了在世界上享有声誉的空气质量专家,来自 urbanemissions.info 的 Dr Sarath Guttikunda 博士,她回复到:
你说的这些是对的。差别是由于对于PM2.5和PM10的不同拐点 (break points), 流行病学的数据与PM2.5及PM10浓度的不同幅度 是如何关联的。 (how the epidemiological data is correlated to each of the fractions)
所以,下一个问题是关于PM10的关联(中肯),尤其是在中国,大多数时候(尤其是被确认过的)都是完全正确的,这空气质量指数中PM2.5是具有显著优势的价值,因此,我们依然需要PM10的检测吗?它还是中肯的吗? 此外,当遇到从他出得到了PM10的空气质量指数比PM2.5的高的情况时呢?有关这个问题,我们再次咨询了 Sarath Guttikunda 博士,他回复到:
现在有新的研究可以提供证据,即PM2.5比PM10更为有害。 从身体角度来说,这可以说明,更小的颗粒更有可能进入肺的深处来伤害我们。这也是世界卫生组织(WHO)推动所有的国家拥有PM2.5标准的一个重要原因之一。非常感谢Sarath Guttikunda博士既迅速又专业的解答。
有关问题,当我们进行PM2.5的时候,还需要有PM10浓度吗?是的,我们依然需要。在PM2.5的分数在PM10里提高的时候,对于大多数污染来自交通及燃烧城市, 经常被忽视非燃烧源就是再-悬浮尘埃(来自公路尘埃和尘暴),是形成Coarser分数的一部分(从PM2.5到PM10)。如果我们突然停止检测PM10,我们就会忽视这一来源。
在中国和印度的大多数城市依旧只检测PM10。因此。这也是我们不能从等式里移除的另一个原因。
(翻译:Lynn)
(Click here for the english version )
有关从浓度到 AQI 转换的更多信息,您可以参考AQI 计算器以及此AQI 量表说明。
第一个监测站主要由 上海美国总领事馆维护, 后两个监测站的数据由 上海市环境监测中心提供,都是政府管理的监测中心。
如担心一些检测站所报道的数据比其他的网站的数值低,可参考以下的图表;这些图表显示了以上提到过的三个监测站最近5天有关的监测数据:
关于空气质量与空气污染指数
| 空气质量指数 | 空气质量指数级别(状况)及表示颜色 | 对健康影响情况 | 建议采取的措施 |
| 0 - 50 | 一级(优) | 空气质量令人满意,基本无空气污染 | 各类人群可正常活动 |
| 51 -100 | 二级(良) | 空气质量可接受,但某些污染物可能对极少数异常敏感人群健康有较弱影响 | 极少数异常敏感人群应减少户外活动 |
| 101-150 | 三级(轻度污染) | 易感人群症状有轻度加剧,健康人群出现刺激症状 | 儿童、老年人及心脏病、呼吸系统疾病患者应减少长时间、高强度的户外锻炼 |
| 151-200 | 四级(中度污染) | 进一步加剧易感人群症状,可能对健康人群心脏、呼吸系统有影响 | 儿童、老年人及心脏病、呼吸系统疾病患者避免长时间、高强度的户外锻炼,一般人群适量减少户外运动 |
| 201-300 | 五级(重度污染) | 心脏病和肺病患者症状显著加剧,运动耐受力降低,健康人群普遍出现症状 | 儿童、老年人及心脏病、肺病患者应停留在室内,停止户外运动,一般人群减少户外运动 |
| 300+ | 六级(严重污染) | 健康人群运动耐受力降低,有明显强烈症状,提前出现某些疾病 | 儿童、老年人和病人应停留在室内,避免体力消耗,一般人群避免户外活动 |
如果你想了解更多有关空气质量与污染,详见维基百科或者 AirNow
有关健康建议详见北京的Richard Saint Cyr MD医生的博客:www.myhealthbeijing.com

This page has been generated on Saturday, Jul 27th 2024, 08:02 am CST from jp2n
设置
Celcius |