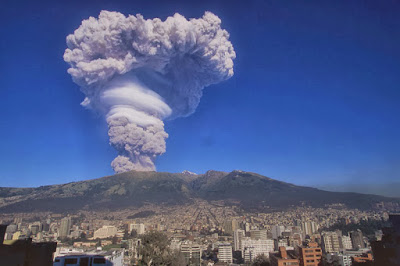
Guagua Pichincha volcano in Ecuador (Attribution)
Beijing citizens do know for long that the best natural way to clean the pollution in the air is strong winds from the North, while winds from the south might, on the contrary, bring more pollution from Hebei.
In Quito, Ecuador, there is a similar problematic, except that the pollution comes from the active volcanos. Fortunately, they do not erupt that often, but when they erupt, better avoid being under the the heavy ash cloud formed by the explosive eruptions (see picture).
It is actually the Air Quality team from Quito Ambiente, with whom we have been recently cooperating, that indicidated us that the 4 volcanos with most concerns are Cotopaxi, Reventador, Guagua Pichincha and Tungurahua.
Although the volcanoes are not so near from Quito, Guagua Pichincha and Reventador did recently cover Quito with ashes.
Ancient reports also show that last time Cotopaxi erupted, Quito got covered with a cloud of ash which stayed for a whole week!
--
Considering that the wind forecast which is already availalbe for Quito, and that each time volcano are erupting an alert is sent to the Quito Ambiente team, the obvious question is wether it is possible to predict the direction the ash cloud will take, and more importantly, whether the 1.5 million citizen living in Quito would be at risk (in which case, the Quito Ambiente would send preventive alerts).
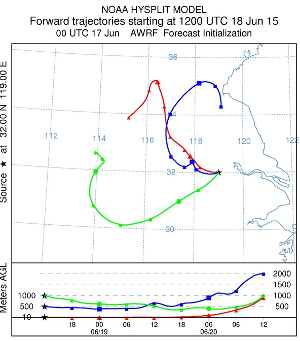
The map below is showing the 8 days forecast for both Wind Direction and Speed (in m/s) at 250mb (approx 10KM) for the 4 above mentioned volcanos. The wind forecast data is based on the latest GFS 0.25° data, which is updated every 6 hours, and has a 3 hours interval. The horizontal and vertical lines in blue are showing the 0.25° grid, so any point between the grid is calculated as the interpolation of the 4 corners.
The wind path are showing the forward trajectory for the next 8 hours (with a 10 minute precision). Each point on the trajectory is computed using the wind data from the point own location instead of the source location (as it was done in the first version of this article). Moreover, since the GFS is only available with a 3 hours resolution, any data between two 3 hours point is linearly interpolated.
This is of course far enough from being perfect, but this is already a good indication in case of volcano eruption. We will of course continue optimizing the wind model used in this map. One obvious improvement is to take into account the wind vertical speed (as shown on the bottom part of the graph on the right), since, when changing altitude, the wind also changes direction (in the current simulation, constant altitude is assumed).
--
All the dates below are in UTC (GMT+0)
Wind trajectory colors:
--
Isobaric level 100mb: ~15KM.
Isobaric level 250mb: ~10KM.
Isobaric level 550mb: ~5KM.
