Много често получаваме запитвания от потребители, които питат за числата, публикувани в проекта за Световен индекс на качеството на въздуха , и се чудят за разликата със стойностите, изразени в други уебсайтове. И това всъщност е нормално, тъй като числата, наричани още индекси на качеството на въздуха (AQI), могат да бъдат много объркващи за начинаещите. Последното съобщение, което получихме е следното:
Проверяваме индекса за качество на въздуха за Тиендзин, Китай от миналата година, но открихме, че данните имат толкова голяма разлика между вашия уебсайт и друг официален (air.tjemc.org.cn), който е посочен и на вашия. Чудя се кой може да даде по-точни данни, тъй като това ще повлияе на решението за открито или закрито. Моля, помогнете ми с този проблем. Благодаря ти!
Писали сме доста по този въпрос и преди, например от сравнителни данни за PM 2.5 за Шанхай , Сингапур PSI и PM 2.5 AQI и по-скоро за текущата прогноза .
Но тъй като все още получаваме много въпроси, сега пишем тази статия, за да обясним разликата между скалите за AQI, използвани по целия свят.
Първата част на тази статия ще се съсредоточи върху Китай, а втората част ще разшири сравнението с везни, използвани в Япония, Южна Корея, Индия, Тайланд, Малайзия, Европа, Мексико и т.н.
Обратно към първоначалния въпрос относно индекса за качество на въздуха в Тиендзин, Китай, двете снимки по-долу са моментни снимки на уебсайта на EPA на Тиендзин air.tjemc.org.cn. Картината вляво показва концентрацията на PM 2,5 , а тази вдясно преобразуваната AQI.
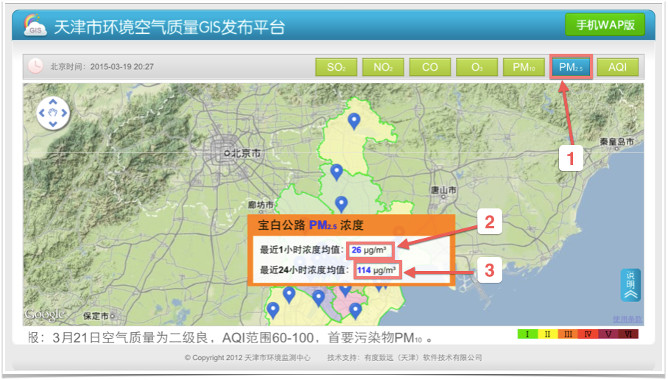 | 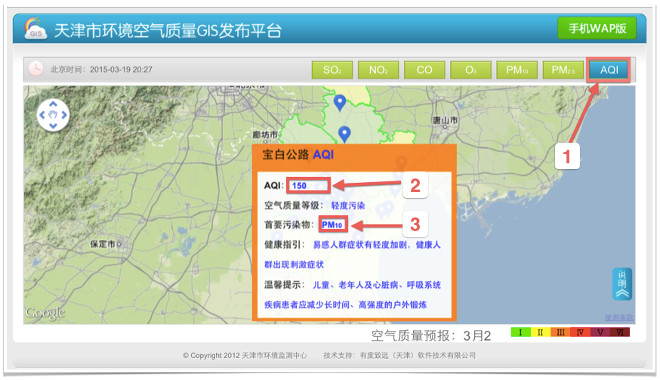 | 1 hour 2 and 24-hours 3 average PM2.5 readings 1 in µg/m3 | AQI values 2 and dominent pollutant 3 |
Започвайки от снимката вляво, стойностите, подчертани като 2 и 3 , всъщност дори не са преобразувани в нито една скала на AQI, а просто обикновени необработени показания, изразени в микрограмове на кубичен метър (µg/ m 3 ). Някой може да си помисли, че предоставянето на необработени стойности е странно, но това всъщност е много по-често, отколкото би се очаквало.
Много Бюра за опазване на околната среда (EPB) по целия свят предоставят само сурови непреобразувани стойности.
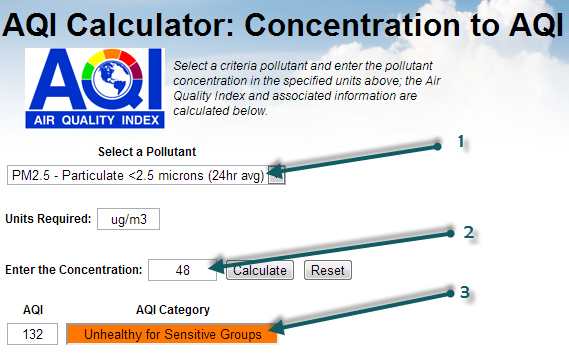
В проекта World Air Quality Index се предоставят само стойности, преобразувани в скалата на US EPA. За да конвертирате необработените стойности в скалата на US EPA, можете просто да използвате калкулатора airnow (моментна снимка вдясно) или нашата собствена версия на същия калкулатор :
Използването на калкулатора е лесно: За да преобразувате, например, показанията на PM2,5, изберете замърсителя PM 2,5 1 , след това въведете масовата концентрация 2 и накрая щракнете върху Изчисли, за да получите съответната фигура 3 на AQI.
Така че, когато проверявате данните за качеството на въздуха, предоставени на други уебсайтове, винаги внимателно проверявайте единицата за данните и се уверете, че сте ги преобразували в скалата на AQI, ако са изразени като необработени µg/ m 3 . Обърнете внимание, че в проекта за Световен индекс на качеството на въздуха се предоставя само AQI въз основа на 1-часово отчитане (а не средно за 24 часа). Ако искате да научите обяснението, проверете тази публикация за сегашната прогноза .
След това, за снимката вдясно (отчитания на AQI), става малко по-сложно, тъй като има различни видове скали на AQI по целия свят.
Световната здравна организация (СЗО) предлага насоки за качеството на въздуха въз основа на прегледи на натрупаните научни доказателства.
Но почти всяка страна има своя собствена скала и това важи и за Китай, който използва скалата, известна като HJ 633-2012 . Тази, която се използва в проекта за Световния индекс на качеството на въздуха, е скалата на US EPA . Но тъй като графиките са по-добри от много думи, ето двете скали за замърсителя PM 2,5 .
Най-важното е да забележите, че за AQI от 200 и повече, двете скали имат еднакви гранични точки. Така че следващия път, когато проверявате данните за качеството на въздуха, предоставени на други уебсайтове, винаги внимателно проверявайте уреда за данните и не забравяйте да проверите коя скала за AQI се използва.
Във втората част на тази статия ще пишем за други скали, използвани в света, и ще има някои много интересни изненади, като например скалата AQI, използвана за Ulanbaataar и нейния диапазон от 100-250 ниско замърсяване ...
--
За повече информация относно конкретни държави или континент, моля, вижте тези статии: Тайланд и Мализия - Индия - China - Хонконг/Канада (здравен индекс за качеството на въздуха) - Южна Америка - Австралия - Квебек и Монреал - Сингапур - Полша - Индонезия .
За информация относно използваното 24-часово осредняване или озон и прахови частици (PM 2,5 ), моля, вижте тези две статии: Индекс на земния озон - PM 2,5 Instant Cast
