We recentely had the privilege to start a cooperation with the NASA Remote Sensing monitoring program.;
The objective is to use the Remote Air Quality sensing based on the NASA Satelites to determine the Air Quality in areas where sensors are not available (e.g. over the sea, but also for countries where sensors are not yet available).
At first glance, the remote satellite sensing theory and the algorithms needed to process this huge-data seems a bit barbarian for non-scientist, having to handle, for instance, data sets like the Aerosol Optical Depth (aka AOD) and Aerosol Optical Thickness (aka AOT). But, actually, the NASA did an excellent work at making the data very easy to use and understand by anyone, but also freely available (in public domain)!
There are many topics we are going to be writing about the use of the satellite data, along with our cooperation with the NASA ARSET program. But to start with, we want to introduce one of their products called the world-view, which is so easy and intuitive to use, and so much worth beeing known by every one. The very nice feature of worldview is the ability to provide historical view, so that you can check the data for any day in the past few years (and, again, for free).
The picture below is dated from Janurary 14th, and shows the Modis Aqua layer together with the Fire and Thermal Anomalies (plotted as red spots). For people leaving in Singapore, this view might be common since the Singapore EPA is providing Satellite hotspot monitoring, especially to monitor fires from Indonesia.
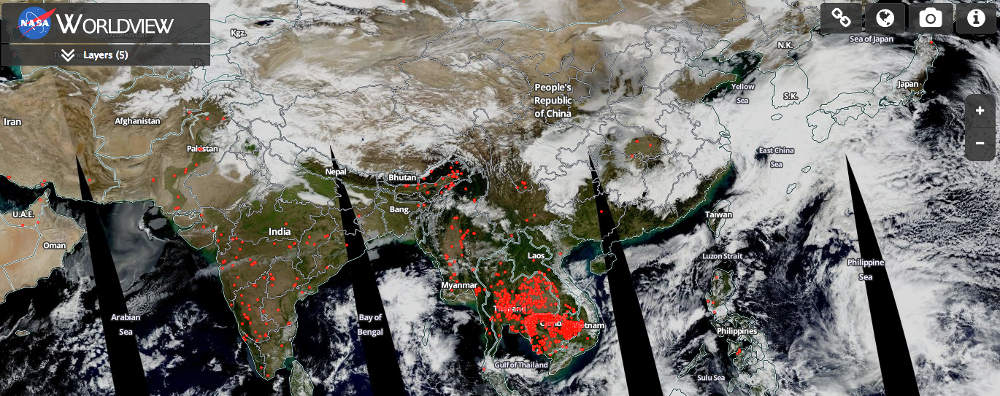
Same image available from the NASA world view server: https://earthdata.nasa.gov/labs/worldview/
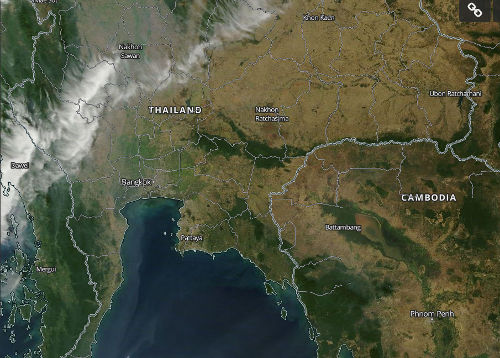
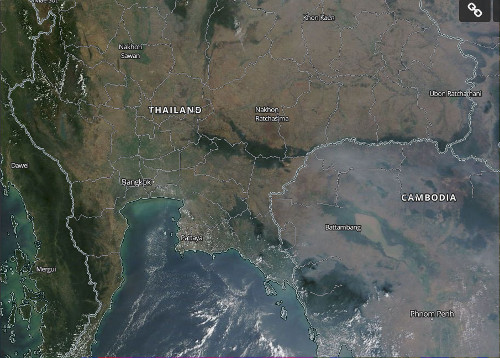
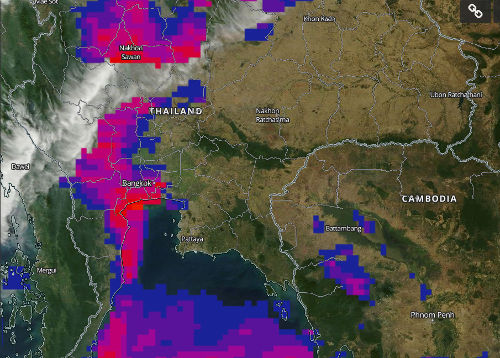
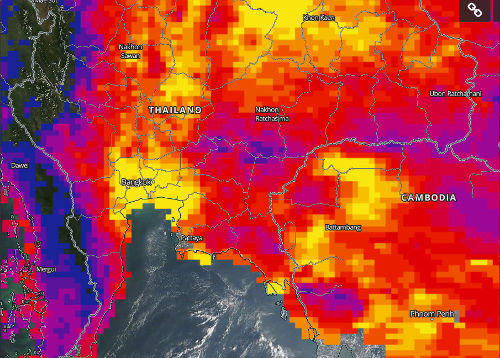
This is other set of snapshots show a comparative view of Thailand and Cambodia for two days. One with an almost clear sky (on the left), and the other one with a visible haze (on the right). By using the Aerosol Optical Depth (AOD) overlay (snapshots at the bottom), the zones detected as the most hazy are highlighted with red to yellow color. Comparing the top and bottom snapshots, there is no doubt that using the AOD is the right way to detect the pollution, and thereby determine the quantity of PM2.5 in the air. That's something we will write very soon about.
| | |
 |  |
| | |
 |  |
Please note that what looks like haze does not always particule matter - PM2.5 pollution. Haze can be mix of smoke, dust and pollution. In some case (see this article) it can also be due to humidity.
One limitation of the satellite data is that it is available only on a daily basis (instead of hourly for ground monitoring), and that it does not work with cloudy sky (obviously, the satellite can't see though the clouds, at least for Aqua and Terra). But even, despite those limitations, it is a great tool with so many possibilities: Providing data for countries without sensors, providing a source for global and worldwide air quality forecast, ...
