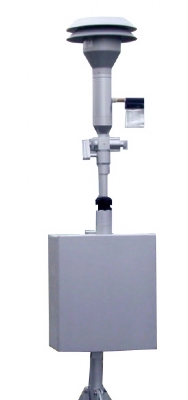
The most common way to measure air quality, as far as it concerns PM10 and PM2.5 particules, is to use the so-called Beta Attenuation Monitors, aka BAM (see picture on the right). Those are profesional equipment, and also the only official equipment used for Air Quality monitoring in China, US, and most of the world. The most famous manufacter is the US-based company called Met-One.
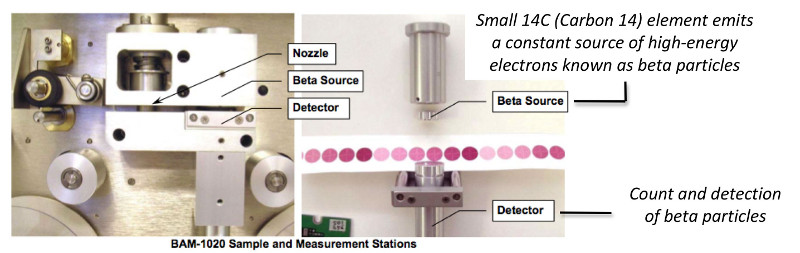
The BAM working principle is quite simple: It measures the decrease in the number of beta particles (electrons) transmitted through a thin layer of particulate matter (PM). As the thickness of the PM layer is increased, the lower the number of beta particules can go through.
The only problem with this kind of BAM equipment is that the cost, estimated to 120K CNY (15K EUR). In China only, there are around 500 of those (around 10 station for each city), and yet, this is not enough as there are still many cities without any PM2.5 readings. In Thailand, there are 21 automatic (i.e. with hourly reading) stations, but none of them provide PM2.5 data. And in Vietnam, there are only 3 stations for the entire country.
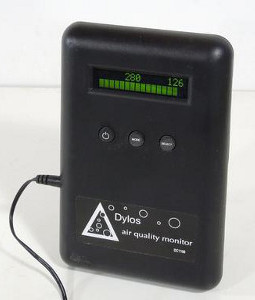
So, while waiting for all the world governments to invest in brand new Beta Attenuation Monitors, is there anything that could be done? Then answer is yes! There are actually relatively affordable equipment that can be used to measure the PM10 and PM2.5 based Air Quality. The most famous one is the Dylos Air Particule counter:
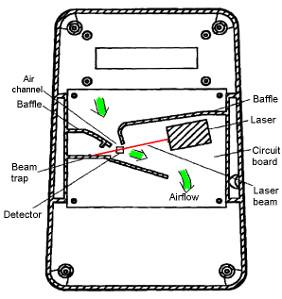
If you want to know how the Dylos Air Particule counter is working, please refer to the excellent reverse engineering work from Matthias from woodgears.ca, or simply from Dylos's website (www.dylosproducts.com/). You can also refer to the resarch paper A low-cost instrument for environmental particulate analysis based on optical scattering to understand the theory behind the measurement.
Note: this article was written in 2013. While the Dylos monitor is still a good product, there is nowdays much better and affordable monitoring products, so we do not recommend purchasing the Dylos product anymore.
You can for instance check the GAIA air quality monitoring stations product range from ES Labs.
--
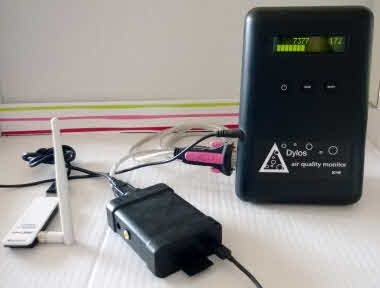
In order to prove the point that such Dylos equipment could be used as an temporary solution for measuring Air Quality, we setup a small experiment in our labs, based on the Dylos DC 1100 Pro, with PC interface. The Dylos PC 1000 pro is relatively inexpensive, and can be bought from Amazon for $319.
Please, note that you must get the pro, with PC interface version. The Pro is needed to be able to measure particules as small as PM2.5, as the non-pro version can only detect PM10 particules or larger. The PC interface version mandatory as it provides a Serial interface, needed for automatically extracting the data from the dylos monitor to the PC.
If you buy the equipment from China, from taobao or jndong (jd.com), please be carefull and make sure to order the right version. The most common version in the DC 1100 without PC interface. Only few shop on taobao provide this right version, and at the present time of writing, jd.com does not even provide the correct version. If you need help for buying for equipement from China, you can contact us with the subject "Dylos Equipment Order", and we will help you for the ordering.
--
In order to automatically extract the data to send it to the server, a Raspberry PI ($56) and a serial to USB cable ($9) is used, totalizing a BOM of $375. (You can buy all this material from Amazon by clicking on the images below)
 |  |  |
| Dylos DC1100 pro with PC interface | Serial to USB cable | Raspberry PI |
The documentation and scripts for connecting the Dylos particules counter to the Raspberry PI, and automatically uploading the dylos data to the World Air Quality Index project server are available freely from github: github.com. If you have any questions, you can contact us with the subject "Dylos Experiment".
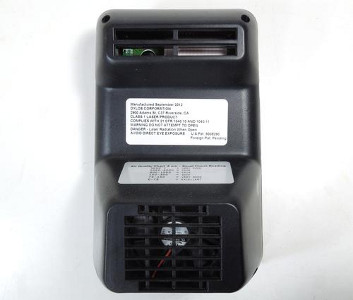
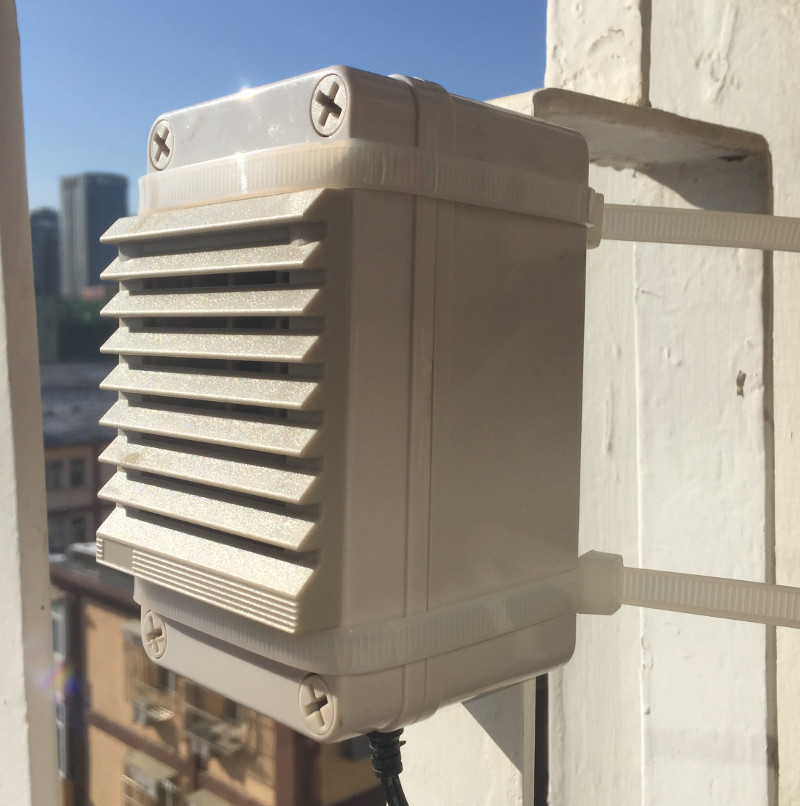
Also, please note that when you setup your Dylos Particule Counter outside, you need to be carefull where you locate it. Ideally, it should be in a place which is not too windy, as the wind can have a significant impact on the readings (The reason is that the Dylos counter is using a simple fan to get the air inflow, and the volume of air inflow per minute needs to be constant in order to have accurate readings ~ This simple fan is one of the reason why this kind of material is so affordable compared to the professional MetOne BAM sensors).
--
In order to compare the Dylos reading with the BAM reading, we use the BAM data provided by Beijing Chaoyang Agricultural Exhibition Hall (朝阳农展馆), as our station is located in the Sanlitun Soho area.
And here is the real-time result: The line in blue is the dylos reading (updated every minute), and the line in red the BAM data (updated every hour). The first graph is to compare the PM10 reading, while the second graph compares the PM2.5. Also, please note that the BAM data is provided in µg directly, i.e. not converted to the AQI grades.

(Click on the picture to open the real time version)
As you can see, the similitude between dylos and BAM reading is quite high, but yet not always fully comparable. In the second part of this post (which we will write after two month, once we have collected enough data), we will provide more statistical data about the readings.
Also, if you are interested in joining this experiment, by setting up your own Dylos station, please contact us. We will provide all the scripts and detailled setup, as well as to add you the sensor database, so that you can see your readings in real-time.
--
As a follow up of this post, you can check the new post about the Dylos Air Particule Conter experiment maintenance.

