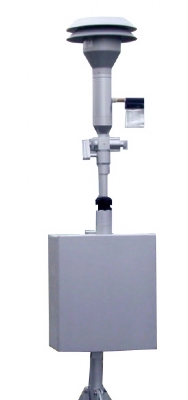
PM 10 및 PM 2.5 입자와 관련된 공기 품질을 측정하는 가장 일반적인 방법은 소위 BAM이라고도 불리는 베타 감쇠 모니터 (BAM)를 사용하는 것입니다(오른쪽 그림 참조). 이는 전문 장비이며 중국, 미국 및 전 세계 대부분의 대기 질 모니터링에 사용되는 유일한 공식 장비입니다. 가장 유명한 제조업체는 Met-One 이라는 미국 기반 회사입니다.
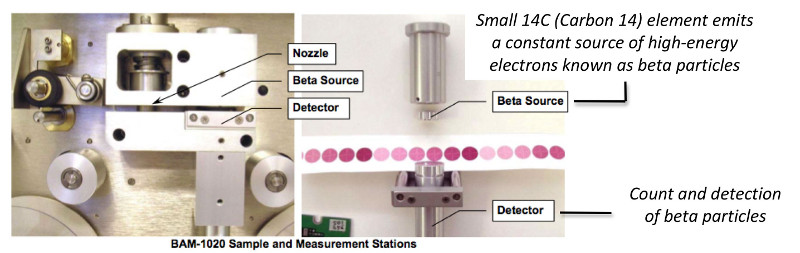
BAM 작동 원리는 매우 간단합니다. 얇은 입자상 물질(PM) 층을 통해 전달되는 베타 입자(전자) 수의 감소를 측정합니다. PM층의 두께가 두꺼워질수록 통과할 수 있는 베타 입자의 수가 적어집니다.
이러한 종류의 BAM 장비의 유일한 문제점은 비용이 120K CNY(15K EUR)로 추산된다는 것입니다. 중국에만 500개 정도(도시당 10개 정도)가 있지만 아직 PM 2.5 측정값이 없는 도시가 많아 이 만으로는 부족하다. 태국에는 21개의 자동(즉, 시간별 판독 기능 포함) 관측소가 있지만 그 중 PM 2.5 데이터를 제공하는 관측소는 없습니다. 그리고 베트남에는 전국에 역이 3개밖에 없습니다.
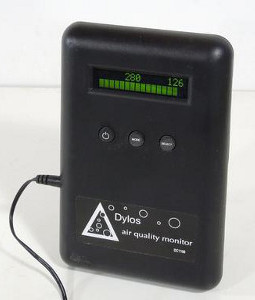
그렇다면 전 세계 정부가 새로운 베타 감쇠 모니터에 투자하기를 기다리는 동안 할 수 있는 일이 있을까요? 그렇다면 대답은 '예' 입니다! 실제로 PM 10 및 PM 2.5 기반 대기 질을 측정하는 데 사용할 수 있는 상대적으로 저렴한 장비가 있습니다. 가장 유명한 것은 Dylos 공기 입자 계수기입니다.
Dylos 공기 입자 계수기가 어떻게 작동하는지 알고 싶다면 woodgears.ca 또는 Dylos 웹사이트( www.dylosproducts.com/ )에서 Matthias의 탁월한 역설계 작업을 참조하십시오. 측정에 대한 이론을 이해하려면 광학 산란을 기반으로 한 환경 미립자 분석을 위한 저가형 연구 논문을 참조할 수도 있습니다.
참고: 이 기사는 2013년에 작성되었습니다. Dylos 모니터는 여전히 좋은 제품이지만 요즘에는 훨씬 더 좋고 저렴한 모니터링 제품이 있으므로 더 이상 Dylos 제품 구매를 권장하지 않습니다.
예를 들어 ES Labs의 GAIA 대기질 모니터링 스테이션 제품군을 확인할 수 있습니다.
--
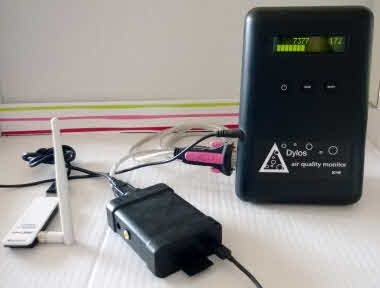
이러한 Dylos 장비가 대기 질 측정을 위한 임시 솔루션으로 사용될 수 있다는 점을 입증하기 위해 우리 실험실에서는 Dylos DC 1100 Pro를 기반으로 PC 인터페이스를 갖춘 작은 실험을 설정했습니다. Dylos PC 1000 pro는 상대적으로 저렴하며 Amazon에서 319달러에 구입할 수 있습니다.
PC 인터페이스 버전의 Pro를 구입해야 합니다. Pro 가 아닌 버전은 PM10 이상의 입자만 감지할 수 있으므로 Pro는 PM 2.5 만큼 작은 입자를 측정할 수 있어야 합니다. PC 인터페이스 버전은 dylos 모니터에서 PC로 데이터를 자동으로 추출하는 데 필요한 직렬 인터페이스를 제공하므로 필수입니다.
중국, taobao 또는 jndong(jd.com)에서 장비를 구입하는 경우 주의해서 올바른 버전을 주문하십시오. PC 인터페이스 가 없는 DC 1100의 가장 일반적인 버전입니다. taobao에서는 소수의 상점만이 올바른 버전을 제공하며, 현재 이 글을 쓰는 시점에서 jd.com은 올바른 버전조차 제공하지 않습니다. 중국 장비 구매에 도움이 필요하신 경우, "Dylos 장비 주문"이라는 제목으로 연락주시면 주문 도와드리겠습니다.
--
데이터를 자동으로 추출하여 서버로 보내기 위해 Raspberry PI($56)와 직렬-USB 케이블($9)을 사용하여 총 BOM은 $375입니다. (아래 이미지를 클릭하시면 아마존에서 모든 자료를 구매하실 수 있습니다)
 |  |  |
| Dylos DC1100 pro with PC interface | Serial to USB cable | Raspberry PI |
Dylos 입자 계수기를 Raspberry PI에 연결하고 dylos 데이터를 세계 대기 질 지수(World Air Quality Index) 프로젝트 서버에 자동으로 업로드하기 위한 문서 및 스크립트는 github: github.com 에서 무료로 제공됩니다. 문의사항이 있으시면 "Dylos Experiment"라는 제목으로 연락주시기 바랍니다.
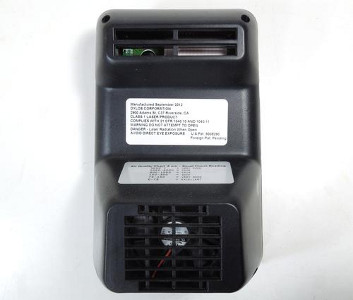
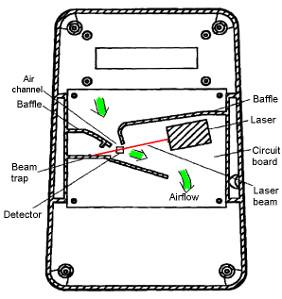
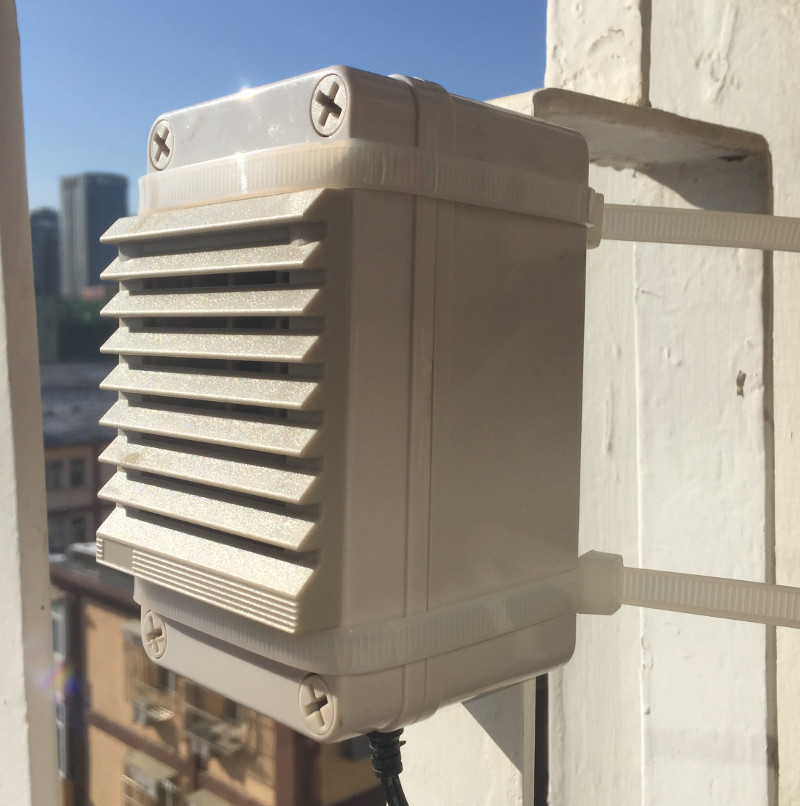
또한, Dylos 입자 계수기를 외부에 설치하는 경우 위치에 주의해야 합니다. 이상적으로는 바람이 판독값에 큰 영향을 미칠 수 있으므로 바람이 많이 불지 않는 곳에 있어야 합니다. (이유는 Dylos 카운터가 공기 유입을 위해 간단한 팬을 사용하고 유입되는 공기의 양이 정확한 판독값을 얻으려면 분당 일정해야 합니다. 이 단순한 팬은 이러한 종류의 재료가 전문적인 MetOne BAM 센서에 비해 가격이 저렴한 이유 중 하나입니다.
--
Dylos 판독값과 BAM 판독값을 비교하기 위해 우리 관측소는 Sanlitun Soho 지역에 있으므로 Beijing Chaoyang Agricultural Exhibition Hall(朝阳农 Exhibition馆)에서 제공한 BAM 데이터를 사용합니다.
실시간 결과는 다음과 같습니다. 파란색 선은 dylos 판독값(1분마다 업데이트됨)이고 빨간색 선은 BAM 데이터(1시간마다 업데이트됨)입니다. 첫 번째 그래프는 PM 10 수치를 비교하고, 두 번째 그래프는 PM 2.5 를 비교합니다. 또한 BAM 데이터는 µg 단위로 직접 제공됩니다. 즉, AQI 등급으로 변환되지 않습니다.

(Click on the picture to open the real time version)
보시다시피, dylos와 BAM 판독값 간의 유사성은 상당히 높지만 항상 완전히 비교할 수 있는 것은 아닙니다. 이 게시물의 두 번째 부분(충분한 데이터를 수집한 후 두 달 후에 작성 예정)에서는 판독값에 대한 더 많은 통계 데이터를 제공할 것입니다.
또한, 자신만의 Dylos 스테이션을 설정하여 이 실험에 참여하고 싶다면 저희에게 연락해 주세요 . 우리는 모든 스크립트와 세부 설정을 제공할 뿐만 아니라 센서 데이터베이스를 추가하여 판독값을 실시간으로 볼 수 있습니다.
--
이번 포스팅에 이어 Dylos Air Particule Conter 실험 점검 에 대한 새로운 포스팅을 확인하실 수 있습니다.
