Visual recognising the Air Quality Index - a case applied to Hanoi

Posted on February 8th 2015
Поділіться: aqicn.org/faq/2015-02-08/visual-recognising-the-air-quality-index-a-case-applied-to-hanoi/uk/

Earlier this week (of February 2015), we got several inquries from Hanoi citizen wondering about the Air Quality Index which was displayed on the Hanoi page (city/vietnam/hanoi).

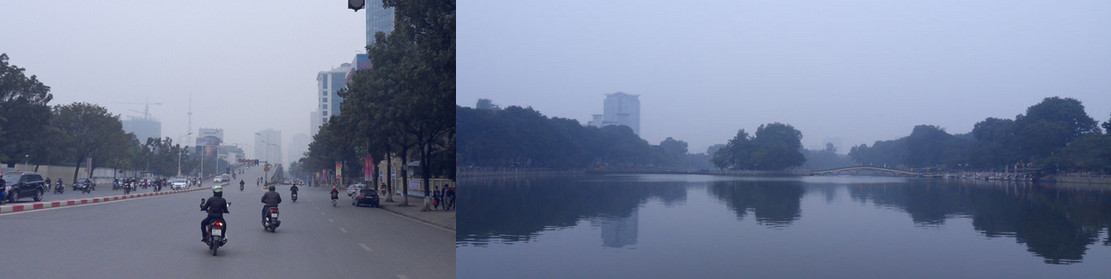
The main reason for the inquiry was that the Air Quality Index displayed on the World Air Quality Index project was around 50 (green AQI) level, while the outdoor visibilty in Hanoi looked like this:


For reference, on the same day in Beijing where the Air Quality Index in Beijing was arround 180 level, the visibility looks like this picture:


One interesting comment on the above picture for Beijing is that the right-part of the picture is having a worst visibility than the left part. This is actually completely normal, pollution is not always uniform, and depending on the wind direction, one part of the city can have relatively good air quality while the other part can be much worse.


oOo

When comparing the visibility for Hanoi and Beijing (see pictures on the right for a comparitive zoomed view), there is no doubt that Air Quality for both cities is at similar level, and, for sure, than if the Beijing AQI is about 180, then it is very likely than Hanoi AQI is much higher than 50.

However, please note that, sometimes, the poor visibility is due to high humidity rather than air pollution (smog). The easiest way to differenciate between humidity and smog is by checking the haze color. If it is yellow or grey, then very likely this is due to smog. But if it is a clean white, then most likely what you are seeing is water vapor (i.e. humidity).

In case you still have some doubts, you can also refer to the Air Quality forecast for your region: The forecast always starts with the current day, so you can check from the first frames of the forecast animation the AQI level for your city.

oOo

When you notice such issue with reported Air Quality - then, please, drop us an email and we will do the necessary to check, verify the data, and contact the relevant local EPA to get the issue fixed.

The problem with Hanoi actually happened to be an issue with the monitoring station itself emitting too low values. Once the problem was well identified and acknowledged, it took no time for the local Hanoi EPA (Environment Protection Agency) to fix the issue and get the monitoring station working normally again. Many thanks again to the Hanoi EPA for the effort and quick action.

Click here to see all the FAQ entries
  • AQI Scale: What do the colors and numbers mean?
  • Using Statistical Distances for Real-time Sensor Networks Validation
  • Nitrogen Dioxyde (NO2) in our atmosphere
  • Про якість повітря та вимірювання забруднення:

    Про рівень якості повітря

    -Значення індексу якості повітря (AQI).Рівні занепокоєння здоров'ям
    0 - 50ДобреЯкість повітря вважається задовільною і забруднення повітря становить незначний ризик або не становить ризику взагалі
    51 -100ПомірнийЯкість повітря є прийнятною; однак, для деяких забруднюючих речовин може спостерігатися помірна загроза здоров'ю для дуже невеликої кількості людей, що незвично чутливі до забруднення повітря.
    101-150Нездоровий для чутливих групЛюди з чутливими органами дихання можуть відчувати дискомфорт. Здорові люди скоріше за все не відчують впливу.
    151-200НездоровийКожен може почати зазнавати впливу на здоров'я; члени чутливих груп можуть мати серйозніші наслідки для здоров'я
    201-300Дуже, нездоровийПопередження про небезпеку для здоров'я, надзвичайна ситуація. Все населення, швидше за все, зазнає впливу.
    300+НебезпечнийНебезпека: будь-хто може зазнати більш серйозних наслідків для здоров'я

    Щоб дізнатися більше про якість повітря та забруднення, перегляньте тему «Якість повітря» у Вікіпедії або посібник airnow «Якість повітря та ваше здоров’я» .

    Щоб отримати дуже корисні поради щодо здоров’я пекінського лікаря Річарда Сен-Сіра, відвідайте блог www.myhealthbeijing.com .


    Повідомлення про використання: Всі дані за якістю повітря є неперевіреними на момент публікації, і в зв'язку з забезпеченням якості цих даних, вони можуть бути змінені в будь-який час та без попереднього повідомлення. Проект Світового індексу якості повітря доклав усіх розумних навичок та обережності щодо збирання цієї інформації, і ні за яких обставин проектна команда Світового індексу якості повітря , або її агенти, не будуть нести відповідальність за договором, правопорушенням чи іншим чином за будь-які втрати, пошкодження або збитки, що виникають безпосередньо чи опосередковано від надання цих даних.


    Settings


    Language Settings:


    Temperature unit:
    Celcius