Fragen Sie sich, was die verschiedenen Farben und Zahlen unten bedeuten?
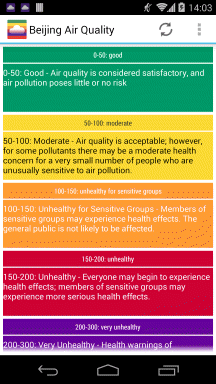
Bei den Zahlen handelt es sich um die Luftqualitätsindizes , die auf einer Skala von 0 (gut) bis 500 (schlecht) basieren. Die Farben entsprechen den verschiedenen Gesundheitsauswirkungskategorien (gut, mäßig, ungesund ... gefährlich).
(credits)
Im Jahr 2008, als das World Air Quality-Projekt begann, basierten alle bestehenden Luftqualitätsüberwachungsstationen auf hochprofessioneller und teurer BAM- und TOEM-Technologie. Diese Art von Stationen werden stets von professionellen und hochqualifizierten Bedienern gewartet – und das stellt sicher, dass die Ergebnisse dieser Station vertrauenswürdig sind.
12 Jahre später existieren die BAM- und TOEM-Stationen immer noch. Aber mit der Entwicklung der Laserstreuungstechnologie und kostengünstigen Staubsensoren sind die BAM- und TOEM-Stationen mittlerweile zahlenmäßig in der Überzahl durch riesige und dichte kostengünstige Sensornetzwerke. Heutzutage gibt es einfach so viele dieser Netzwerke – um nur einige zu nennen: Urad, Luft-Daten, Airqo, AirBG, OpenSense, Yakkaw, Econet, Airkaz, CCDC, Ambente, Green Air usw.
Univ. of Arizona (credits)
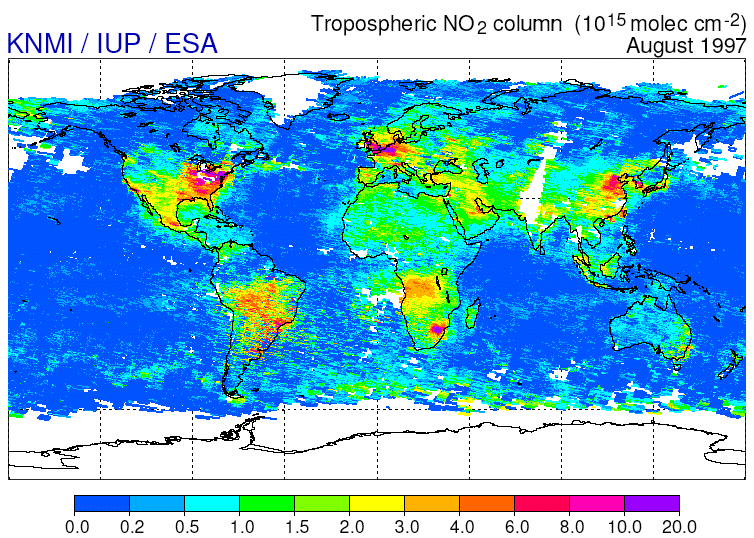
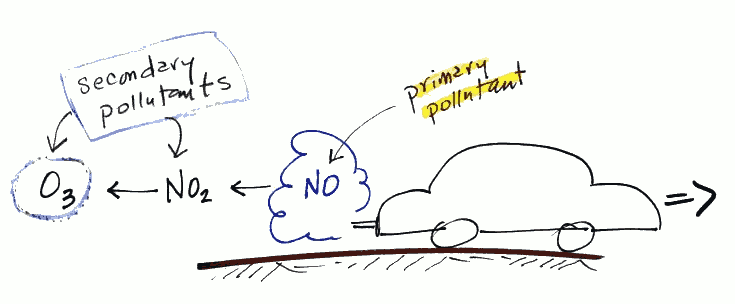
Eine häufig gestellte Frage lautet: Warum sind die Konzentrationen von Stickstoffdioxid (NO 2 ), Schwefeldioxid (SO 2 ) und Kohlenmonoxid (CO) immer so niedrig und ist es sinnvoll, sie zu messen?
Um die Bedeutung der Überwachung dieser Stoffe hervorzuheben, wird in diesem Artikel erläutert, woher diese Schadstoffe kommen und wie sie sich auf unsere Gesundheit und die Umwelt auswirken.
Um es kurz zu halten, konzentriert sich dieser Artikel nur auf NO2.
Univ. of Arizona (credits)
Es ist bereits mehrere Monate her, dass die US-Umweltbehörde EPA ihren AQI-Standard für Ozon-8-Stunden-Grenzwerte aktualisiert hat . Dies ist definitiv ein positiver Schritt zur Verbesserung der Luftqualität in den USA, da der US-amerikanische EPA-Standard tatsächlich zu den am wenigsten konservativen Standards für Ozon gehörte, verglichen beispielsweise mit ähnlichen Standards in Indien, China oder Europa!
Aber noch interessanter ist, dass AirNow kürzlich einen Schritt weiter gegangen ist und die Ozone NowCast- Formel eingeführt hat, die es ermöglicht, den gewichteten 8-Stunden-Breakpoint-Standard anstelle des 1-Stunden-Breakpoints zu verwenden. Diese Änderung, die das AirNow-Team der Öffentlichkeit nicht umfassend mitgeteilt hat, führt zu einer erheblichen Änderung der Art und Weise, wie der Ozon-AQI gemeldet wird, und darauf werden wir uns in diesem Artikel konzentrieren.

In den letzten Monaten hat das World Air Quality-Team an der Analyse mehrerer neuer Luftqualitäts-Prognosemodelle sowie an der Verbesserung des Demonstrators für das Luftqualitäts-Prognosemodell gearbeitet.
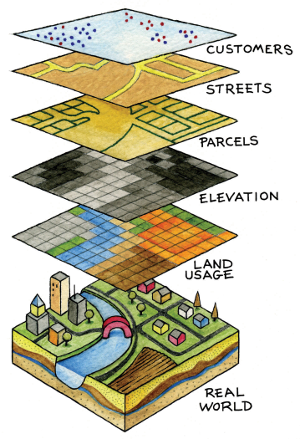
In diesem Artikel wird der neueste Prognosemodell-Demonstrator vorgestellt, der auf der Gridded Population of the World ( GPW ) basiert und zur Analyse der Luftqualitätsprognose für die Region Nordindien (einschließlich Bangladesch, Pakistan und Nepal) eingesetzt wird.
Wir haben schon oft über den Einfluss des Windes auf die Luftverschmutzung geschrieben und darüber, wie starker Wind (oder genauer gesagt starke Belüftung ) dazu beitragen kann, die Luft in kürzester Zeit zu reinigen. Aber wir hatten nie die Gelegenheit, eine dynamische Visualisierung dieses Phänomens zu erstellen, deshalb wird es in diesem Artikel darum gehen.
Es ist fast zwei Monate her, dass unsere Kollegen vom UNEP einen interessanten Schritt zur Förderung der Idee unternommen haben, dass Luftqualität genauso wichtig ist wie jedes andere Geschäft innerhalb der Vereinten Nationen. Sie begannen, in diesen Bereich zu investieren, und entwickelten die hervorragende Initiative, eine offene Fläche für erschwingliche Luftqualitätsüberwachungsstationen zu schaffen.

Dies ist ein kleiner Beitrag des World Air Quality Index- Projekts an das ASMC – ASEAN Specialized Meteorological Center ( asmc.asean.org ) während dieser starken Dunstperiode in Südasien.
In letzter Zeit kooperieren wir mit zahlreichen weiteren EPAs (Environmental Protection Agency) weltweit. Unter all den Anfragen, die wir hatten, ging es tatsächlich darum, einen Web-Kartendienst bereitzustellen, damit die EPA selbst die Echtzeit-Luftqualitätsdaten von ihrer Website in die Karte integrieren kann.
Einer der offensichtlichen Vorteile der Nutzung eines solchen Karten-Webdienstes von uns besteht darin, von den grenzüberschreitenden Daten zu profitieren, die wir kuratieren, d. h. es werden weltweite Informationen zur Luftqualität ohne Ländergrenzen bereitgestellt.
Der zweite Vorteil besteht nicht nur darin, dass es sich um einen kostenlosen Dienst handelt, sondern er ist auch vollständig kompatibel mit Standard-Kartentechnologien von Google, Bing oder Leaflet, was eine schnelle und einfache Integration in jede bestehende Website ermöglicht.
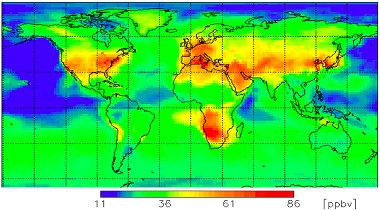
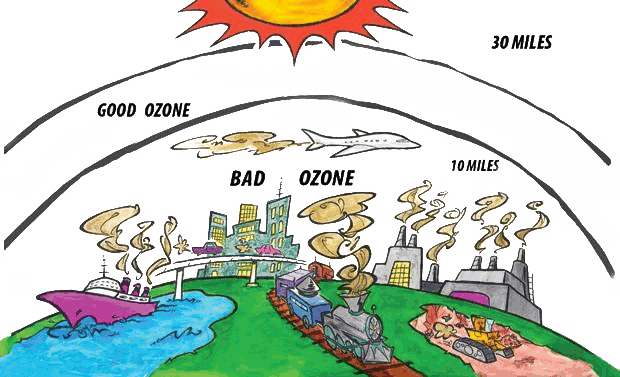
Das Umgebungsozon , das als O 3 bezeichnet wird und auch als bodennahes oder troposphärisches Ozon bezeichnet wird, wirkt sich auf jeden auf der Erde aus, unabhängig vom Land, wie im Bild rechts gezeigt .
(Attribution: WMO GAW research on reactive gases )
Im Gegensatz zu Feinstaub (PM 2,5 ) wird bodennahes Ozon nicht direkt emittiert. Stattdessen entsteht es durch eine Reihe chemischer Reaktionen, die in Gegenwart von Stickoxiden, flüchtigen organischen Verbindungen, Sonnenlicht und hohen Temperaturen ablaufen, wie in der folgenden Abbildung dargestellt:

Die Quantifizierung der Auswirkungen dieses bodennahen Ozons auf die Gesundheit erfolgt über den Luftqualitätsindex-Standard, den jedes Land definiert. Interessant ist, dass die Hälfte der Welt einen Standard verwendet, der auf der Milligramm-Messung basiert, während der Rest eine ppb-basierte Messung verwendet. Aber ist das wirklich ein Problem? Darauf werden wir uns in diesem Artikel konzentrieren.

Inspekcja Ochrony Środowiska.
(Inspection of Environmental Protection)
Die Luftqualitätsdaten für Polen sind schon seit einiger Zeit verfügbar, aber wir haben kürzlich einige Fragen zur AQI-Skala erhalten, die von der Inspekcja Ochrony Środowiska , also den regionalen Umweltschutzinspektionen, verwendet wird, und wie sie sich von der Skala der Weltluft unterscheidet Qualitätsindex-Projekt. Eine davon stammt von Sylwia, die fragte:
Ich bin verwirrt über all diese Zahlen und warum es einen Unterschied zu den Zahlen auf der Warschauer EPA-Website gibt.
Könnten Sie mich bitte über die Datenquelle in Warschau und die Zuverlässigkeit der von Ihnen bereitgestellten Daten informieren?
Das ist eigentlich eine sehr gute Frage, denn wenn es um Daten geht, sollte niemand Daten als „selbstverständlich“ betrachten (in Anlehnung an den hervorragenden TED-Vortrag von Talithia Williams zum Thema „Own your body's data“). Aus diesem Grund gibt es auch das Projekt „World Air Quality Index“, nämlich um jedem zu erklären, wie man die Zahl hinter der Luftverschmutzung versteht.
Um die Integration unserer AQI-Widgets in externen Websites zu verbessern, haben wir einen neuen Widget-API-Feed entwickelt. Im Vergleich zum bestehenden Widget-Feed bietet dieser neue API-Feed viel mehr Flexibilität bei der Integration, aber auch viel mehr Optionen zum Anpassen des Widget-Erscheinungsbilds.

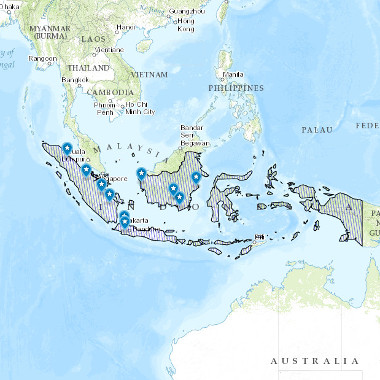
Für Indonesien sind jetzt Echtzeitdaten zur Luftqualität verfügbar. Zehn Stationen in Großstädten in ganz Indonesien messen die PM10- Verschmutzung in Echtzeit.
Die Messstationen werden von BMKG ( Badan Meteorologi Klimatologi dan Geofisika ), dem indonesischen Ministerium für Meteorologie, Klimatologie und Geophysik, betrieben.
Die Luftqualitätsdaten für Montreal und Quebec sind schon seit einiger Zeit verfügbar, aber wir haben kürzlich einige Fragen zur AQI-Skala erhalten, die in diesem Teil Kanadas verwendet wird. Eine davon stammt von Marie A., die fragte:
Ich würde gerne wissen, warum sich der Luftqualitätsindex auf Ihrer Website vom AQI auf der Website von Montreal unterscheidet. Berechnen Sie etwas neu, um die US-amerikanischen EPA-AQI-Standards zu erfüllen? Wenn das so ist, wie? Mit welchen Daten?
Das ist in der Tat eine sehr gute Frage. und wir werden in diesem Artikel die verschiedenen verwendeten Skalen erklären, wie die Skalen miteinander verglichen werden und wie die Umrechnung durchgeführt werden kann.
Dank der Projektgemeinschaft des World Air Quality Index sind jetzt Übersetzungen für die polnische Sprache für die Website und die Webanwendung verfügbar. Vielen Dank insbesondere an den Benutzer „ AiRs “ für den hervorragenden Beitrag.
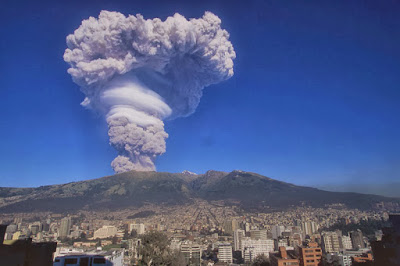
Guagua Pichincha volcano in Ecuador (Attribution)
Die Bürger Pekings wissen seit langem, dass der beste natürliche Weg, die Luftverschmutzung zu beseitigen, starke Winde aus dem Norden sind, während Winde aus dem Süden im Gegenteil zu mehr Verschmutzung aus Hebei führen könnten.
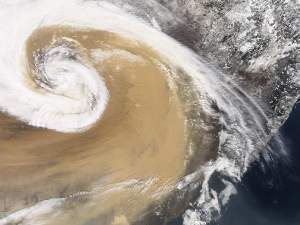
In Quito , Ecuador, gibt es ein ähnliches Problem, nur dass die Verschmutzung von den aktiven Vulkanen herrührt. Glücklicherweise kommt es nicht so oft zu Ausbrüchen, aber wenn sie ausbrechen, sollte man besser vermeiden, sich unter der schweren Aschewolke aufzuhalten, die durch die explosiven Ausbrüche entsteht (siehe Bild).

Es ist schon lange her, dass die EPA von Hongkong ihren Standard für den Luftqualitätsindex vom traditionellen Luftverschmutzungsindex auf den sogenannten Air Quality Health Index (AQHI) aktualisiert hat, aber wir haben bis jetzt noch nie eine Änderung erfahren, die wir uns genauer ansehen könnten es, was wir in diesem Artikel tun werden.
Die Hong Kong EPA hat tatsächlich hervorragende Arbeit bei der Erklärung geleistet, wie der AQHI definiert ist, und die Informationen, die man zum Verständnis des AQHI benötigt, sind auf ihrer Website verfügbar. Die offensichtlichste Vereinfachung ist die Änderung des traditionellen Index von 0 bis 500 in einen neuen, vereinfachten Bereich von 0 bis 10 + , der in fünf Gesundheitsrisikokategorien unterteilt ist, wie unten dargestellt:
| LOW | MODERATE | HIGH | VERY HIGH | SERIOUS | |||||||||||||||||
| | | | | 1 | 2 | 3 | 4 | 5 | 6 | 7 | 8 | 9 | 10 | 10+ | | ||||||
Tatsächlich gibt es aber noch viel mehr als nur eine Vereinfachung des Sortiments: Das neue AQHI führt auch das sehr clevere Konzept des Added Health Risk (%AR) ein, das ursprünglich 2007 von einem Team aus vier Partnern aus Südafrika definiert wurde in Kanada verwendet.
Die Luftqualitätsvorhersage für Südamerika ist jetzt im Rahmen des World Air Quality Index-Projekts in Zusammenarbeit mit dem brasilianischen Centro de Previsão do Tempo e Estudos Climáticos ( CPTEC ) verfügbar. Die Vorhersage kann kostenlos unter cptec.inpe.br sowie unter Forecast/South-America/ abgerufen werden.
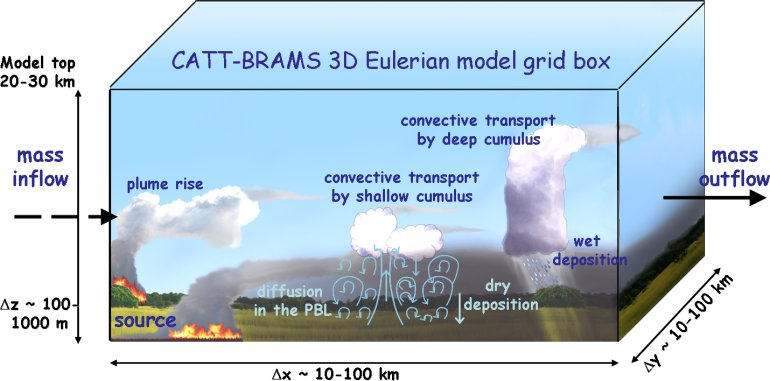
Das CPTEC-Team hat hervorragende Arbeit geleistet und eine einfache und detaillierte Erklärung zu den zugrunde liegenden Konzepten geliefert, die in ihrem Prognosemodell namens BRAMS (für brasilianische Entwicklungen im Regional Atmospheric Modeling System ) verwendet werden. Das Bild unten (vom CPTEC) gibt einen Einblick in den Arbeitsablauf für ihr Modell (Quelle -> Transport -> Ablagerung).
(Attribution: Houston Clean Air Network )
Die Berechnung des Boden-Ozon-Luftqualitätsindex wurde gerade aktualisiert, um dem Instant Cast-Konzept zu folgen, d. h. die Verschmutzung jetzt zu melden und nicht die Verschmutzung der vorherigen Stunden. Weitere Informationen zum Instant Cast finden Sie in diesem Artikel .
Bei der Berechnung des Ozonindex wird jetzt der stündliche Messwert anstelle des vorherigen 8-Stunden-Durchschnitts verwendet, es wird jedoch immer noch die gleiche 8-Stunden-AQI-Breakpoint-Formel für AQI unter 100 angewendet. Das bisherige Verfahren zur Berechnung der 8-Stunden-Durchschnittskonzentrationen wird nicht verwendet mehr für die sofortige Berichterstattung. Oberhalb des AQI 100 werden die normalen 1-Stunden-Ozongrenzwerte verwendet (während zuvor der AQI über 100 als Maximum der 1-Stunden- und 8-Stunden-Messwerte definiert wurde).
Es ist bereits mehr als ein Jahr her, seit die Weltgesundheitsorganisation ihre „Datenbank zur Luftverschmutzung im Freien in Städten 2014“ veröffentlicht hat. Das WHO-Team, das an diesem Projekt gearbeitet hat, hat hervorragende Arbeit dabei geleistet, die Daten für so viele Länder zu sammeln und alles an einem einzigen, für alle zugänglichen Ort zusammenzuführen.
Wir haben in mehreren unserer früheren Artikel darüber geschrieben (z. B. über die Luftqualität in Afrika oder in Lateinamerika ), hatten jedoch nie die Gelegenheit, uns die verschiedenen Optionen zur Visualisierung ihres Datensatzes anzusehen. Darüber werden wir in diesem Artikel schreiben.
(Tiranga, तिरंगा)
Das indische Central Pollution Control Board hat kürzlich im April 2015 die Veröffentlichung des indischen National Air Quality Index Standard ( NAQI ) angekündigt. Alle Einzelheiten zu diesem Standard finden Sie bei CPCB , Wikipedia oder in diesem Bericht des Indian Institute of Technology, Kanpur ( iitk.ac.in ).
Dies ist tatsächlich ein sehr wichtiger Fortschritt im weltweiten Bewusstsein für Luftqualität, da die Luftverschmutzung in jedem Land sehr stark von der Art der Landesverschmutzung abhängt: Zum Beispiel durch Staub (auf der Arabischen Halbinsel), durch Verkehr (Neu-Delhi). oder Topographie (Chile).
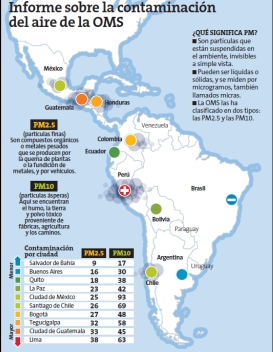
Lateinamerika ist wie jeder andere Kontinent unserer Welt mit Luftverschmutzung konfrontiert. Der aktuelle Bericht der Weltgesundheitsorganisation über die Luftverschmutzung (im Freien) aus dem Jahr 2014 enthält einige jährliche Durchschnittswerte für mehrere Städte in Lateinamerika. Es überrascht nicht, dass die schlimmsten Szenarien in Asien herrschen, aber auch einige Städte in Lateinamerika weisen hohe Indizes auf (siehe Tabelle links).
Die Einstufung der WHO sollte jedoch sorgfältig geprüft werden, insbesondere angesichts der verwendeten Messmethoden. Über den Bericht lässt sich streiten – für Lima beispielsweise argumentiert die peruanische EPA, dass die Daten der WHO nicht korrekt seien, da die Proben nicht entnommen wurden die richtigen Orte (lesen Sie diesen Artikel von P. Estupinya für vollständiges Feedback aus mehreren Ländern). Aus diesem Grund veröffentlichen wir nur Echtzeitinformationen zum World Air Quality-Projekt, da wir davon überzeugt sind, dass es für den Weltbürger nicht nur auf die aktuellen Bedingungen ankommt, sondern auf die aktuellen Bedingungen.
(Jalur Gemilang)
Die Luftqualität für Malaysia ist schon seit langem verfügbar, aber im Gegensatz zu anderen Ländern wird nur der zusammengesetzte AQI bereitgestellt. Der AQI für die einzelnen Schadstoffe wie PM 10 , Ozon ... ist nicht verfügbar, was die Umrechnung auf die US-EPA-Skala erschwert.
Glücklicherweise werden die Informationen über die in Malaysia verwendete AQI-Skala, auch bekannt als API (für Air Pollutant Index), im Dokument „ A Guide to Air Pollutant Index in Malaysia “ klar erläutert.

Die Balkanhalbinsel, im Volksmund auch Balkan genannt, ist eine geografische Region Südosteuropas. Die Region hat ihren Namen vom Balkangebirge, das sich vom Osten Serbiens bis zum Schwarzen Meer im Osten Bulgariens erstreckt.
Viele Länder auf dem Balkan stellen Echtzeitmessungen der Luftqualität bereit. Die Daten für die Türkei (Thrakien), Rumänien und Kroatien sind bereits seit längerem im Projekt World Air Quality Index verfügbar. Heute sind wir in der Lage, die Daten für drei neue Länder bereitzustellen: Serbien , Bulgarien und Mazedonien .
Wir hatten die Ehre, von Dr. Pawan Gupta vom NASA Applied Remote Sensing Training ( ARSET )-Team eingeladen zu werden, einen Vortrag über unser World Air Quality Index- Projekt beim Webinar „Earth Observations and Tools for Air Quality Applications“ zu halten:
Wenn man über Luftqualität spricht, denkt man als Erstes an China und Indien und ganz allgemein an Asien. Auch beim World Air Quality Index-Projekt lag Asien von Anfang an im Fokus (höchstwahrscheinlich, weil sich hier unser Hauptquartier befindet!).
Vor ein paar Jahren, im Jahr 2012, haben wir beschlossen, unsere Reichweite auf die anderen sieben Kontinente auszudehnen, beginnend mit Ozeanien und dann Europa und Nordamerika , Südamerika .
Doch einer von sieben Kontinenten, nämlich Afrika , hinkt überraschend hinterher. Wir haben viele Anfragen zu diesem Datenmangel erhalten, und eine der letzten kam von Said E., der schrieb:
Vielen Dank, dass Sie die Projektseite zum World Air Quality Index erstellt haben. Es gibt sehr nützliche Informationen.
Meine einzige Sorge ist, warum Afrika nicht berücksichtigt wird.
Zur Information: Ich bin marokkanischer Staatsbürger.

STRONG LAPSE CONDITION (LOOPING)

WEAK LAPSE CONDITION (CONING)

INVERSION CONDITION (FANNING)
Examples of Atmospheric Stability (attribution)
Bei der Wettervorhersage werden Vorhersagemodelle verwendet, um zukünftige Zustände der Atmosphäre vorherzusagen, basierend darauf, wie sich das Klimasystem im Laufe der Zeit ausgehend von einem Ausgangszustand entwickelt.
Während die Prognosemodelle recht komplex sind (und starke wissenschaftliche und technische Fähigkeiten erfordern ), ist die Wissenschaft der Analyse dieser Prognosemodelle und der Überprüfung ihrer Genauigkeit durch den Vergleich tatsächlicher empirischer Beobachtungen mit vorhergesagten Werten recht einfach.
Für den Bereich Luftqualität ist es ebenso wie für die Wettervorhersage möglich, Modelle zu definieren, die zur Vorhersage der zukünftigen Luftverschmutzung verwendet werden. Es gibt tatsächlich viele solcher Modelle , die oft als Atmospheric Dispersion Modeling bezeichnet werden. Und genau wie bei der Wettervorhersage kann das gleiche Konzept der Genauigkeitsanalyse auf Vorhersagen der Luftverschmutzung angewendet werden.
Sehr oft erhalten wir Anfragen von Benutzern, die nach den im World Air Quality Index-Projekt veröffentlichten Zahlen fragen und sich über den Unterschied zu den auf anderen Websites ausgedrückten Werten wundern. Und das ist eigentlich normal, denn die Zahlen, auch Air Quality Indexes (AQI) genannt, können für Anfänger sehr verwirrend sein. Die letzte Nachricht, die wir erhalten haben, ist die folgende:
Wir überprüfen seit letztem Jahr den Luftqualitätsindex für Tianjin, China, haben jedoch festgestellt, dass die Daten zwischen Ihrer Website und einer anderen offiziellen Website (air.tjemc.org.cn), die ebenfalls auf Ihrer Website angegeben ist, einen großen Unterschied aufweisen. Ich frage mich, welches genauere Daten liefern kann, da dies die Entscheidung für Außen- oder Innenbereich beeinflusst. Bitte helfen Sie mir bei diesem Problem. Danke schön!
Wir haben schon viel über dieses Thema geschrieben, zum Beispiel anhand eines Vergleichs der PM 2,5- Daten für Shanghai , Singapur PSI und PM 2,5 AQI und in jüngerer Zeit über den Nowcast .
Da wir aber immer noch viele Fragen bekommen, schreiben wir jetzt diesen Artikel, um die Unterschiede der weltweit verwendeten AQI-Skalen zu erklären.

Bereits im März 2015 hatten wir die Gelegenheit, in Peking mehrere Umweltspezialisten des US-Außenministeriums und der China-Mission ( der berühmten Einrichtung, die die PM 2,5- Monitore in der US-Botschaft in Peking betreibt ) zu treffen.
Unter all den angesprochenen Themen gibt es eines, über das es sich zu schreiben lohnt, nämlich das „ Nowcast “-System. Dieses von der US-Umweltschutzbehörde EPA verwendete System wandelt die Messwerte der Rohschadstoffe, ausgedrückt in µg/m3 oder ppb , in den AQI (Skala von 0 bis 500) um. Es wird für alle auf der Website airnow.gov gemeldeten AQI-Werte verwendet.
Das Konzept hinter dem Nowcast besteht darin, die „ 24-Stunden-Mittelung “ zu kompensieren, die bei der Umrechnung von Konzentrationen in AQI verwendet werden sollte. Der Grund für diese Mittelung liegt darin, dass die AQI-Skala angibt, dass jede Stufe der gesundheitlichen Besorgnis (d. h. gut, mäßig, ... ungesund ...) bei einer Exposition von 24 Stunden gültig ist [1] . Wenn man beispielsweise einen AQI von 188 (ungesund) sieht, muss man das so interpretieren: „ Wenn ich 24 Stunden draußen bleibe und der AQI während dieser 24 Stunden 188 beträgt, dann ist die Auswirkung auf die Gesundheit ungesund .“ Das ist etwas ganz anderes als zu sagen: „ Wenn der jetzt gemeldete AQI 188 beträgt, dann ist die Auswirkung auf die Gesundheit ungesund .“

Wir sind gerade in das neue Mondjahr der Ziege eingetreten (kombiniert mit dem Holzelement für 2015), und für das Projektteam des World Air Quality Index bedeutet das, dass mit Hochdruck an der Ausweitung der Luftqualitätsüberwachung auf neue Länder im Südosten gearbeitet wird Asien. Nämlich: Die Philippinen , Kambodscha und Indonesien (und weitere, zB Myanmar und Laos, werden sehr bald folgen).
As there is also a huge demand for PM2.5 monitoring for Thailand (especially Chiang Mai and Bangkok), or for more station in Vietnam (Ho Chi Minh City), the extension will also cover selected countries with existing network.
Aber dieses Mal brauchen wir, anders als in den vorherigen Ländern, die Hilfe aller und insbesondere Ihre Hilfe, wenn Sie in einem dieser Länder leben. Der Grund dafür ist, dass das World Air Quality Index-Projekt dieses Mal damit beginnen wird, Luftqualitätsüberwachungsstationen in den Hauptstädten zu sammeln, da die Echtzeitinformationen zur Luftqualität nicht öffentlich von den Umweltschutzbehörden (EPA) dieser Länder verfügbar sind der oben genannten Länder 1 .

Visible Air Pollution on the Manilla and Jakarta Skylines
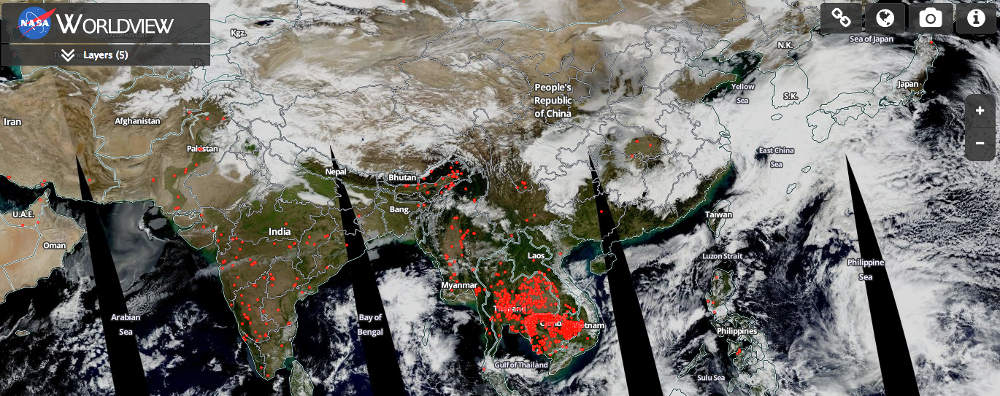
Wir hatten kürzlich das Privileg, eine Zusammenarbeit mit dem NASA-Fernerkundungsüberwachungsprogramm zu starten.;
Ziel ist es, die Luftqualitätsfernmessung auf Basis der NASA-Satelliten zu nutzen, um die Luftqualität in Gebieten zu bestimmen, in denen keine Sensoren verfügbar sind (z. B. über dem Meer, aber auch für Länder, in denen Sensoren noch nicht verfügbar sind).

Anfang dieser Woche (Februar 2015) erhielten wir mehrere Anfragen von Bürgern aus Hanoi, die sich über den Luftqualitätsindex wunderten, der auf der Hanoi-Seite ( Stadt/Vietnam/Hanoi ) angezeigt wurde.
Der Hauptgrund für die Untersuchung war, dass der im World Air Quality Index-Projekt angezeigte Luftqualitätsindex bei etwa 50 (grüner AQI) lag, während die Sicht im Freien in Hanoi wie folgt aussah:

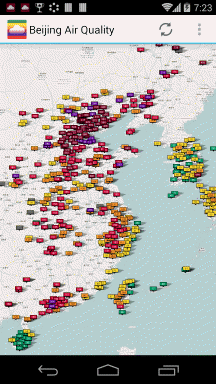
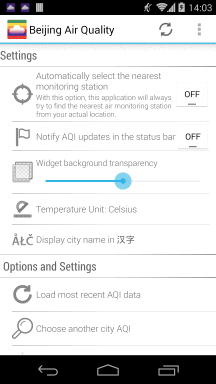
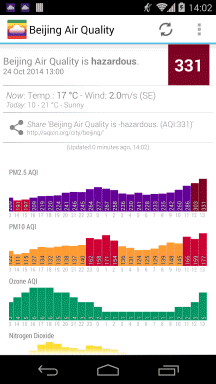
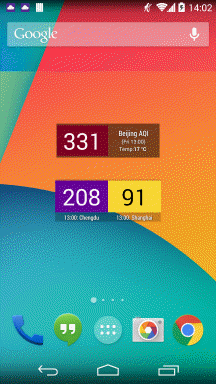
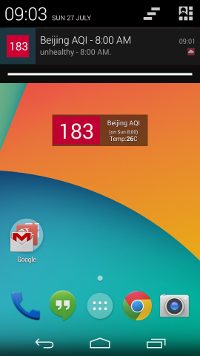
Die neueste Version 3.2 der Android-Anwendung des World Air Quality Index-Projekts wurde gerade veröffentlicht und enthält einige neue coole Funktionen:
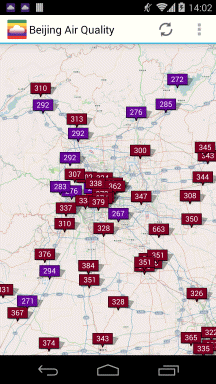
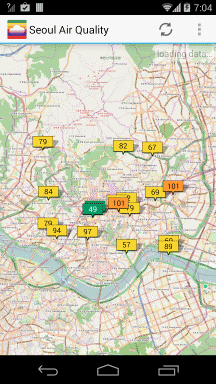
Die eingebettete Karte , mit der Sie direkt von der App aus durch die Weltluftüberwachungsstation navigieren können, und die Registerkarte „ Wind- und Temperaturvorhersage “, die Ihnen die Vorhersage für die nächsten drei Tage liefert. Wir haben auch daran gearbeitet, die visuelle Darstellung zu aktualisieren und die Einstellungen zu aktualisieren, um beispielsweise die Temperaturanzeige in Fahrenheit zu unterstützen.
(Asia)
(North China)
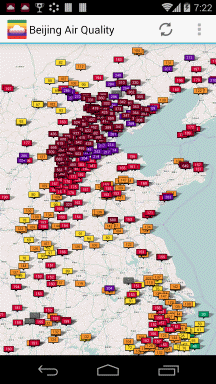
(Beijing)
(Seoul)
Forecast
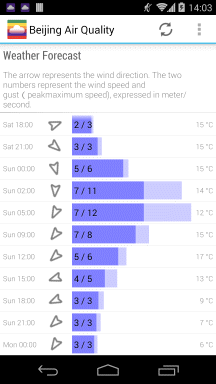
and wind conditions
Widgets
when AQI > 150
the nearest stations
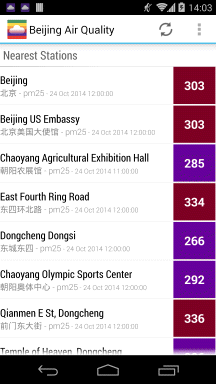
Explanations
Wie jedes zweite Jahr seit 2002 organisieren unsere Kollegen von Clean Air Asia (auch bekannt als Clean Air Initiative) alle zwei Jahre die Better Quality Conference ( baq2014est.org ). Dieses Mal findet es vom 19. bis 21. November 2014 in Sri Lanka statt und wird gemeinsam mit dem Forum Environmentally Sustainable Transport (EST) ausgerichtet.
The "Integrated Conference of BAQ 2014 and Intergovernmental 8th Regional EST Forum in Asia" co-organized by the Ministry of Transport of Sri Lanka, The Ministry of Environment and Renewable Energy of Sri Lanka, Ministry of the Environment of Japan, United Nations Centre for Regional Development, and Clean Air Asia, in partnership with the Asian Development Bank, German International Cooperation (GIZ), and World Bank.
Das diesjährige Thema lautet „Lösungen der nächsten Generation für saubere Luft und nachhaltigen Verkehr – Auf dem Weg zu einer lebenswerten Gesellschaft in Asien“:
Wir sind uns bewusst, dass saubere Luft und nachhaltiger Verkehr für eine lebenswerte Gesellschaft in Asien unerlässlich sind, und fordern innovative und intelligente Lösungen (Politik, Institution, Technologie und Finanzierung) , die die Luftverschmutzung und Treibhausgase aus Energie-, Industrie-, Verkehrs- und regionalen Quellen deutlich reduzieren und Gewährleistung eines sicheren, gerechten, umweltfreundlichen und menschenfreundlichen Verkehrssystems durch Beschleunigung der Umstellung auf einen umweltfreundlicheren Verkehr (EST) in asiatischen Städten und Ländern.
Schauen Sie sich das Programm an. Zur BAQ 2014 werden mehr als 800 Teilnehmer erwartet, und wir werden dabei sein und unsere neuesten Forschungsarbeiten zu erschwinglichen Lösungen zur Überwachung der Luftqualität vorstellen, die wir in unserem Forschungslabor durchgeführt haben.
Die Luftqualitätsdaten für Perth und Westaustralien sind nach langer Wartezeit endlich verfügbar.
Die Abteilung für Umweltregulierung (DER) der Regierung von Westaustralien veröffentlicht die Daten jetzt auf ihrer Website: der.wa.gov.au/your-environment/air .
Während der Link zur DEC-Site immer noch nicht funktioniert, kann der Feed über diese neue Seite aufgerufen werden.
Möglicherweise sind Sie auf eines der neuesten Haier-Produkte namens „Air Box“ (海尔空气盒子) gestoßen, das bei jd.com oder taobao für erschwingliche 399 RMB erhältlich ist. Es handelt sich um ein sehr schön gestaltetes Produkt, das als Teil ihres Smart-Living- Konzepts darauf abzielt, in Verbindung mit einer intelligenten Klimaanlage verwendet zu werden.
Es *behauptet*, sowohl flüchtige organische Verbindungen (VOC, also Ozon) als auch die berühmten kleinen Feinstaubpartikel PM2,5 erkennen und messen zu können. Aber kann es das wirklich tun? Um die Antwort zu erfahren, schauen Sie sich unser neuestes laufendes Experiment zur Air Box unter experiments/haier-air-box an

--

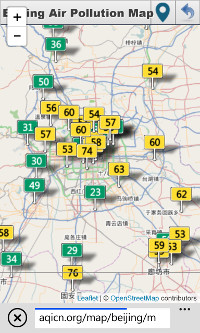
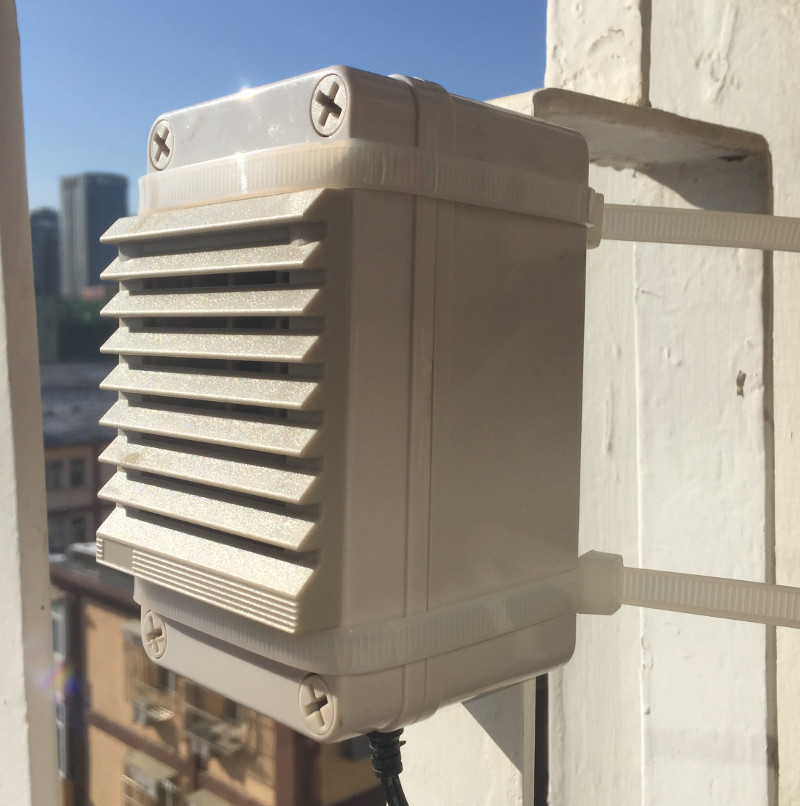
Hinweis: Dieser Artikel wurde im Jahr 2013 verfasst. Obwohl der Dylos-Monitor immer noch ein gutes Produkt ist, gibt es heutzutage viel bessere und erschwinglichere Überwachungsprodukte, sodass wir den Kauf des Dylos-Produkts nicht mehr empfehlen.
Sie können sich beispielsweise die Produktpalette der GAIA-Luftqualitätsüberwachungsstationen von ES Labs ansehen.
Das Dylos Air Particle Counter-Experiment läuft noch, und zwar schon seit 50 Tagen. Letztes Wochenende, als die Luftverschmutzung in Peking dank starker Nordwinde sehr niedrig wurde, nutzten wir diese Zeit als Gelegenheit, eine Wartungspause durchzuführen ... am Dylos-Monitor selbst.
Der Grund dafür ist, dass der Dylos-Monitor, auch wenn er auf jeden Fall ein gut konzipiertes und konstruiertes Gerät ist (wir meinen es ernst), möglicherweise nicht so gut konzipiert ist, um der starken periodischen Luftverschmutzung in Peking standzuhalten.
Alles begann mit der Feststellung, dass die Korrelationsdiagramme zwischen dem Dylos- und dem BAM-Monitor tendenziell einige systematische Anzeichen einer Nivellierung über 38.000 Partikel (≥0,5 µ) zeigen. Ein solches Sättigungssymptom kann die Folge eines Engpasses bei der internen Luftzufuhr sein, der durch „gesättigte“ Luftkanäle verursacht werden kann. In Zeiten starker Luftverschmutzung ist dieses Phänomen völlig normal, da große Mengen an Feinstaub durch den Luftkanal strömen müssen.
Kein Wunder also, dass wir nach dem Öffnen des Dylos-Monitors bestätigten, dass die internen Luftkanäle aufgrund einer Staubansammlung in den letzten 50 Tagen definitiv gesättigt sind:
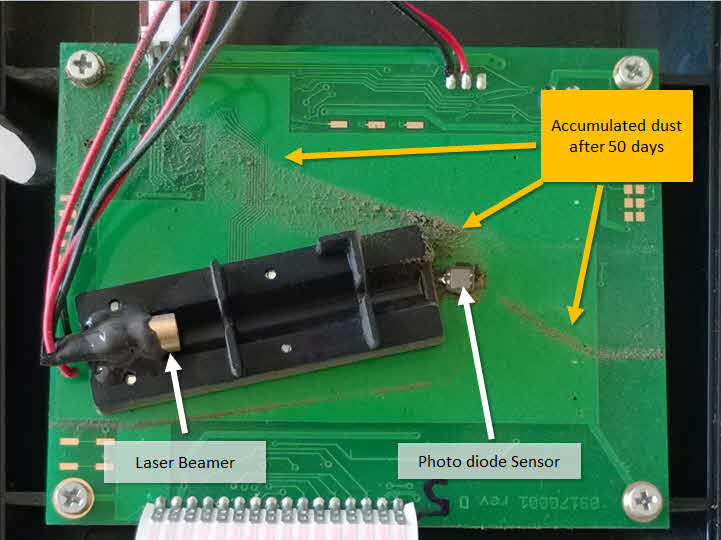
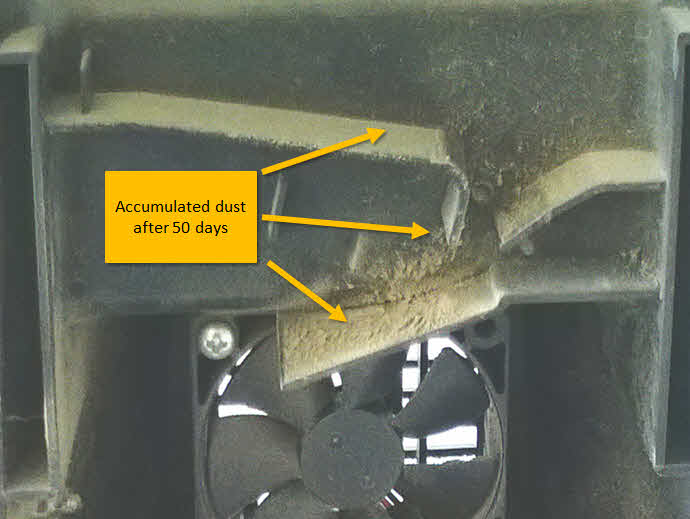
-Beijing dust impact on the Dylos air particle counter internal structure-
Das Ergebnis der Reinigung der inneren Struktur mit einer feinen Bürste würde eine erstaunliche Menge Staub erzeugen – und das bereits nach 50 Tagen Experimentieren im Freien. Denken Sie einfach daran, dass es das ist, was Sie atmen ...
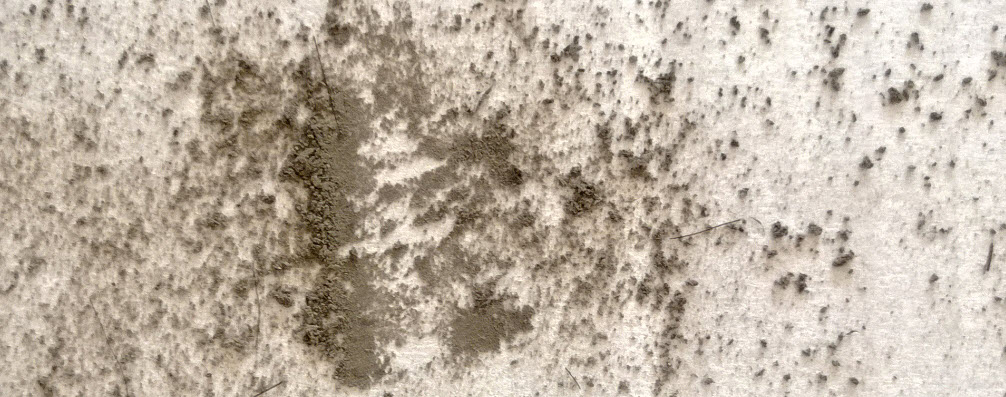
-The real Beijing dust... the one Beijiners breathe during heavy pollution day!-
Tatsächlich ist es keine Überraschung, dass eine solche Reinigung und Wartung an den Dylos-Geräten durchgeführt werden muss, da selbst die sehr teuren BAM-Geräte eine monatliche Wartung durch erfahrene Bediener erfordern.
--
Der folgende Teil wurde 10 Tage nach Veröffentlichung des ersten Beitrags hinzugefügt:
Seit der Reinigung sind nun 10 Tage vergangen und die Situation hat sich hinsichtlich der Korrelation zwischen BAM und Dylos definitiv verbessert. Aus der Grafik unten, die die Messungen vor und nach der Reinigung zeigt, zeigt die mit Nummer (2) gekennzeichnete Zone eine sehr gute Ähnlichkeit (Korrelation) zwischen BAM und Dylos. Bei starker Verschmutzung gibt es jedoch immer noch Anzeichen einer Nivellierung (Abweichung der Messung), wie durch die Zonennummern (1) und (3) hervorgehoben. Die Abweichung scheint jedoch nach der Reinigung (Zone (3) ) weniger schlimm zu sein als vorher (Zone (1) ). Wir kontaktieren die Firma Dylos, um sie zu diesem Nivellierungsphänomen zu konsultieren, und werden diesen Beitrag später aktualisieren.
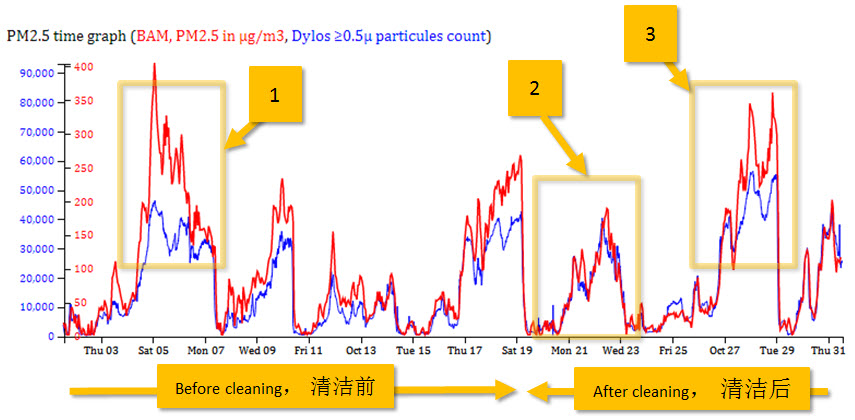
(Click on the picture to open the real time version)
--
Aus irgendeinem historischen Grund basierte die AQI-Umrechnungsformel, die für einige der Städte im World Air Quality Index-Projekt verwendet wurde, nicht auf dem aktualisierten EPA PM 2.5 -Standard von 2012 . (Dies ist nur für Städte in Asien wie Japan und Taiwan relevant. Andere Kontinente (Amerika, Europa und Australien) verwenden seit jeher den Standard von 2012.
Die wichtigste Änderung dieses aktualisierten EPA-Standards, der am 14. Dezember 2012 veröffentlicht wurde, im Vergleich zum vorherigen (1999 veröffentlichten) besteht darin, den PM 2,5- AQI-Wert 50 von 15 µg/m 3 auf 12 µg/m 3 zu reduzieren (zu begrenzen). Dies dient dazu, strengere Luftqualitätsstandards durchzusetzen.
Seit dem 9. September 2013 verwenden nun alle Länder die gleiche PM2,5-AQI-Umrechnungsskala, die in dieser Tabelle widergespiegelt wird:
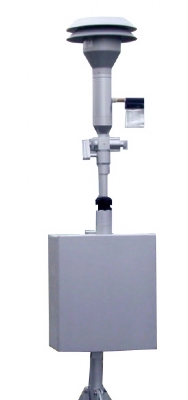
Die gebräuchlichste Methode zur Messung der Luftqualität, soweit es PM 10- und PM 2,5- Partikel betrifft, ist die Verwendung der sogenannten Beta Attenuation Monitors , auch bekannt als BAM (siehe Bild rechts). Hierbei handelt es sich um professionelle Geräte und auch um die einzigen offiziellen Geräte, die in China, den USA und den meisten Teilen der Welt zur Überwachung der Luftqualität verwendet werden. Der bekannteste Hersteller ist das in den USA ansässige Unternehmen Met-One .
Das Funktionsprinzip der BAM ist recht einfach: Sie misst die Abnahme der Anzahl der Betateilchen (Elektronen), die durch eine dünne Schicht Feinstaub (PM) übertragen werden. Je dicker die PM-Schicht ist, desto weniger Beta-Partikel können passieren.

Das einzige Problem bei dieser Art von BAM-Geräten sind die geschätzten Kosten von 120.000 CNY (15.000 EUR). Allein in China gibt es etwa 500 davon (etwa 10 Stationen pro Stadt), und doch reicht das nicht aus, da es immer noch viele Städte ohne PM 2,5 -Messwerte gibt. In Thailand gibt es 21 automatische (dh mit stündlicher Ablesung) Stationen, von denen jedoch keine PM 2,5- Daten liefert. Und in Vietnam gibt es nur 3 Stationen für das ganze Land.
Angesichts des jüngsten südostasiatischen Smogs aus Indonesien, der Singapur und jetzt auch Malaysia heimgesucht hat, haben wir viele Fragen dazu erhalten, warum es einen Unterschied zwischen den Daten gibt, die auf der NEA-Website von Singapur ( nea.gov.sg ) gelesen werden können, und dem World Air Quality Index-Projekt Singapur Website .
Folgendes ist zum Beispiel heute auf der NEA-Website zu lesen:

Aus historischen Gründen verwendet das World Air Quality Index-Projekt die Bezeichnung China MEP (Umweltministerium) für die Luftqualitätswerte. Dies ist nun Vergangenheit und die Bezeichnung folgt von nun an den AirNow-Standards der US-amerikanischen EPA (Environmental Protection Agency).
Die folgende Tabelle fasst die Unterschiede in der Bezeichnung zwischen den beiden Standards sowie die Übersetzungen für die verschiedenen Sprachen zusammen.
Während ich heute über den FAQ-Eintrag zu PM 10 versus PM 2,5 diskutierte, den ich gestern gepostet habe, stellte mein Freund Klaus die Nützlichkeit von Schutzmasken in Frage. Er fragte sich tatsächlich, ob die modernen Masken heutzutage wirklich alle kleinen schädlichen Feinstaubpartikel PM 2,5 effizient filtern können?
Eigentlich ist das eine sehr gute Frage! Wenn Sie in Peking eine Maske tragen müssen, sollten Sie besser darauf achten, dass diese wirklich die schädlichen Partikel filtert.
Da ich keine Antwort auf seine Frage hatte, schrieb ich einfach eine E-Mail an Francis Chu vom totobobo® - Maskenhersteller in Singapur, der in kürzester Zeit antwortete:
Wir haben diese Woche eine sehr gute und relevante Frage von Severine P. erhalten, die nach PM2,5-Konzentrationen im Vergleich zu PM10-Konzentrationen fragte. Was Severine in ihrer Mail fragte, war:
Ich verstehe nicht, warum die PM2,5-Konzentrationen oft höher sind als die PM10-Konzentrationen.
Sind PM, die kleiner als 2,5 Mikro sind, nicht in PM, die kleiner als 10 Mikro sind, enthalten?
Vielen Dank für Ihre Antwort
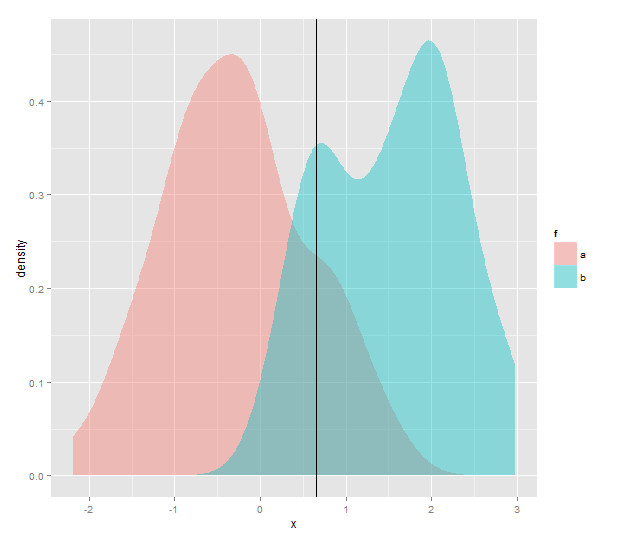
Severines Frage ist völlig richtig: PM2,5 sind per Definition Partikel, die kleiner als 2,5 Mikrometer sind, also sollten sie auch als kleiner als 10 Mikrometer eingestuft werden.
and lúwān shī zhuān fùxiǎo (上海师范专科学校附属小学).
The first station is maintained by US Consulate in Shanghai, while the two last ones are provided by Shanghai Environment Monitoring Center(上海市环境监测中心), which is governmental center.
If you have concerns about some stations reporting lower PM2.5 data compared to others, then refer to the following graphics; they show the relative PM2.5 reporting for the last 5 days for each of the above mentioned stations:
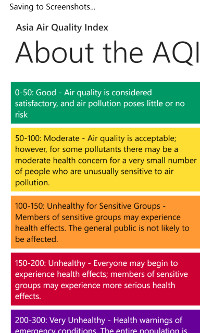
Über Messungen zur Luftqualität und Verschmutzung
| - | Luftqualitätswerte (AQI) | Stufen zur Bewertung der Gesundheitsgefährdung |
| 0 - 50 | Gut | Die Luftqualität wird als zufriedenstellend angesehen, und die Luftverschmutzung birgt wenig oder kein Risiko. |
| 51 -100 | Mäßig | Luftqualität ist akzeptabel; Bei einigen Schadstoffen kann es jedoch für eine sehr kleine Anzahl von Personen, die gegenüber Luftverschmutzung ungewöhnlich empfindlich sind, zu einem mäßigen Gesundheitsrisiko kommen. |
| 101-150 | Ungesund für sensible Gruppen | Mitglieder von sensiblen Gruppen können gesundheitliche Auswirkungen haben. Die breite Öffentlichkeit wird wahrscheinlich nicht betroffen sein. |
| 151-200 | Ungesund | Gesundheitliche Auswirkungen sind für jeden spürbar; für sensible Gruppen besteht möglicherweise ein ernstes gesundheitliches Risiko. |
| 201-300 | Sehr Ungesund | Notfallwarnung vor Gesundheitsgefahren. Die Gesamtbevölkerung ist davon wahrscheinlich betroffen. |
| 300+ | Gefährlich | Gesundheitswarnung: Jeder kann ernstere gesundheitliche Auswirkungen haben |
Um mehr über Luftqualität und -verschmutzung zu erfahren, gehen Sie auf die Seite Luftverschmutzung (Wikipedia) oder den AIRNow Leitfaden für Luftqualität und Ihre Gesundheit der US-amerikanischen Umweltagentur.
Sehr nützliche Gesundheitsratschläge gibt der Pekinger Arzt Richard Saint Cyr MD, www.myhealthbeijing.com in seinem Blog.
