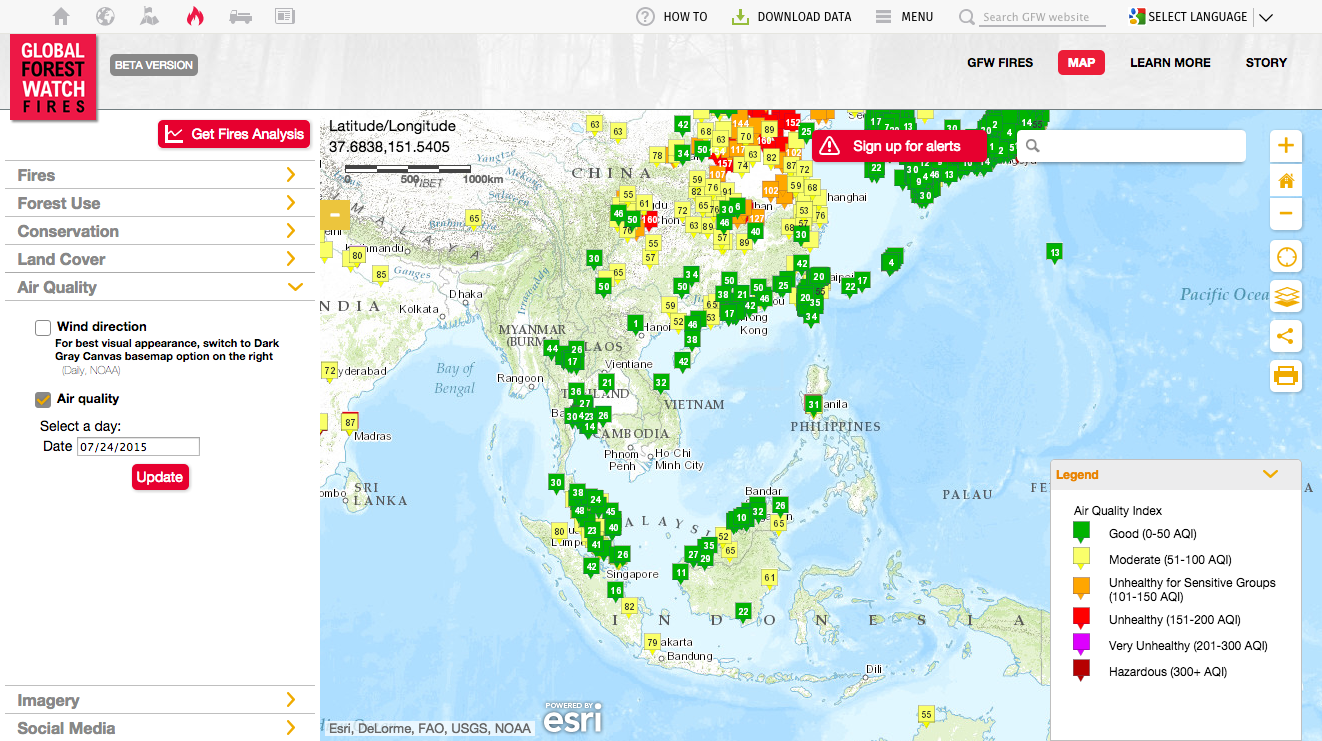
我们最近与世界各地更多的 EPA(环境保护机构)合作。在我们收到的所有请求中,实际上是提供网络地图服务,以便环保局自己可以将实时空气质量数据从其网站添加到地图上。
使用我们提供的此类地图网络服务的明显优势之一是受益于我们正在整理的跨境数据,即提供不受国界限制的全球空气质量信息。
第二个优势不仅在于这是一项免费服务,而且还与 google、bing 或 leaflet 的标准地图技术完全兼容,从而可以快速轻松地与任何现有网站集成。
--
瓦片地图服务端点
瓦片地图服务器可从 URL `https://tiles.aqicn.org/tiles/{aqi}/{z}/{x}/{y}.png` 获取,其中aqi指的是标记的类型绘制出来,可以是:
usepa-aqi: Plots markers based on the composite AQI calculated with the US EPA standard.usepa-pm25: PM2.5 based AQI - if a station does not have PM2.5 reading, then it is not plotted.usepa-10: Same as above, but for PM10.usepa-o3: Same as above, but for Ozone (based on the 1 hour breakpoints).usepa-no2: Same as above, but for Nitrogen Dioxide.usepa-so2: Same as above, but for Sulfur Dioxide.usepa-co: Same as above, but for Carbon Monoxide.asean-pm10: Asean PM10 raw PM10 concentration (explanations).
以下是华南地区 6 种单项污染物的示例。
Web服务使用条件
地图网络服务在合理的使用限制和可接受的使用政策的条件下免费提供。目前,图块每 15 分钟刷新一次(如果流量高,则最多刷新 1 小时)。
请注意,我们的服务器容量有限,因此我们保留随时暂停服务的权利,例如进行服务器性能维护。如果您需要更稳定的集成,请联系我们寻找合适的解决方案,例如设置专用服务器。
最后,您还需要指定您自己的令牌 ID 作为图块服务端点的额外参数,例如以下网址中的“token=_TOKEN_ID_”:“https://tiles.aqicn.org/tiles/{aqi}/{z” }/{x}/{y}.png?令牌=_TOKEN_ID_` 。
您可以从此页面请求您自己的令牌 ID。您只需提供有效的电子邮件,一分钟内即可获得自己的令牌。
网络服务使用限制

使用该服务时,请不要忘记提供世界空气质量指数项目的归属以及提供数据的 EPA(如果您使用地图服务显示来自特定位置或来源的数据)。您可以从此链接获取所有 EPA 的完整列表。
事实上,不要像世界资源研究所(WRI) 那样:他们正在废弃我们的整个数据源,并在他们自己的项目网站上重新发布数据,而没有为我们的工作提供任何单一归属......这不太好当您知道他们每年获得高达8000 万美元的资助时。不相信我们?检查这个快照。
未来的扩展
我们已经在努力扩展此网络服务以提供更多配置。例如:
- To support for more standards other than the US EPA, such as `eucaqi-xxx` for the European Common Air Quality Index, `innaqi-xxx` for the Indian National Air Quality Index , `raw-xxx` for the unconverted raw data, etc.
- 更多指标,例如
wind(当前风速和风向),以及预测ventilation指数[1] ,这对于预测非常有用。 - 支持
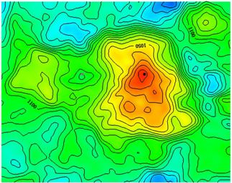
kriging地理统计表面估计 - 即类似热图的插值(右图),这对于低密度监测网络非常有用。 - 支持
24 hours和8 hours数据平均。我们的地图目前基于 1 小时平均,但更长的平均周期对于流行病学研究很有用。 - 支持基于
GeoJSON的图块渲染,允许自定义标记和色标,以及与tuftjs.org等工具更好的集成。
请注意,为了支持更多 AQI 标准和图块配置,我们需要增加服务器容量(处理能力和存储),为此我们需要赞助。如果您正在为一家大型云公司(例如 Google 或 Microsoft)工作并阅读此消息,那么为什么不考虑使您的公司变得环保(通过提高公民意识来对抗空气污染),并赞助部分所需的服务器额外容量?这不仅会帮助我们,还会帮助整个从事环境数据和科学工作的研究人员、科学家、统计学家和流行病学家。
--

示例代码:与 Leaflet 集成
Leaflet是一个非常酷的轻量级开源 JavaScript 库,用于移动友好的交互式地图,由 MapBox 的 Vladimir Agafonkin 创建。
<div id='map' style='height:380px;' />
<link rel="stylesheet" href="http://cdn.leafletjs.com/leaflet-0.7.5/leaflet.css" />
<script src="http://cdn.leafletjs.com/leaflet-0.7.5/leaflet.js"></script>
<script>
var OSM_URL = 'http://{s}.tile.openstreetmap.org/{z}/{x}/{y}.png';
var OSM_ATTRIB = '© <a href="http://openstreetmap.org/copyright">OpenStreetMap</a> contributors';
var osmLayer = L.tileLayer(OSM_URL, { attribution: OSM_ATTRIB });
var WAQI_URL = "https://tiles.waqi.info/tiles/usepa-aqi/{z}/{x}/{y}.png?token=_TOKEN_ID_";
var WAQI_ATTR = 'Air Quality Tiles © <a href="http://waqi.info">waqi.info</a>';
var waqiLayer = L.tileLayer(WAQI_URL, { attribution: WAQI_ATTR });
var map = L.map('map').setView([51.505, -0.09], 11);
map.addLayer(osmLayer).addLayer(waqiLayer);
</script>
示例代码:与 Google 集成
Google 地图非常方便,每天免费调用多达 25,000 个 API。请注意,谷歌地图在中国可用,但地图 API 脚本需要从 google.cn (`http://maps.google.cn/maps/api/js`) 加载,而不是常规的 https://maps .googleapis.com/maps/api/js 网址。
<div  id='map'  style='height:380px;'  />
<script  src="https://maps.googleapis.com/maps/api/js"></script>

<script>
      var  map  =  new  google.maps.Map(document.getElementById('map'),  {
            center:  new  google.maps.LatLng(51.505,  -0.09),
            mapTypeId:  google.maps.MapTypeId.ROADMAP,
            zoom:  11
      });

      var  t  =  new  Date().getTime();
      var  waqiMapOverlay  =  new  google.maps.ImageMapType({
            getTileUrl:  function  (coord,  zoom)  {
                  return  'https://tiles.aqicn.org/tiles/usepa-aqi/'  +  zoom  +  "/"  +  coord.x  +  "/"  +  coord.y  +  ".png?token=_TOKEN_ID_";
            },
            name:  "Air  Quality",
      });

      map.overlayMapTypes.insertAt(0,  waqiMapOverlay);
</script>
示例代码:与 Microsoft Bing 地图集成
Bing 地图实际上非常酷,并且还使用这里的一些国家的底图。仍然有相当多的网站基于微软地图(尤其是在空气质量和天气领域)。
<div  id='map'  style='height:380px;'    style='position:relative;'/>
<script  type='text/javascript'  src='https://www.bing.com/api/maps/mapcontrol?callback=initBingMap'  async  defer></script>

<script>
      function  initBingMap()  {

            var  map  =  new  Microsoft.Maps.Map(document.getElementById('map'),  {
                  center:  new  Microsoft.Maps.Location(51.505,  -0.09),
                  zoom:  11,
            });

            var  options  =  {
                  uriConstructor:  "https://tiles.aqicn.org/tiles/usepa-aqi//{zoom}/{x}/{y}.png?token=_TOKEN_ID_",
                  minZoom:  1,
                  maxZoom:  15
            };
            var  waqiTileSource  =  new  Microsoft.Maps.TileSource(options);
            var  waqiTilelayer  =  new  Microsoft.Maps.TileLayer({  mercator:  waqiTileSource  });
            map.layers.insert(waqiTilelayer);
      }
</script>