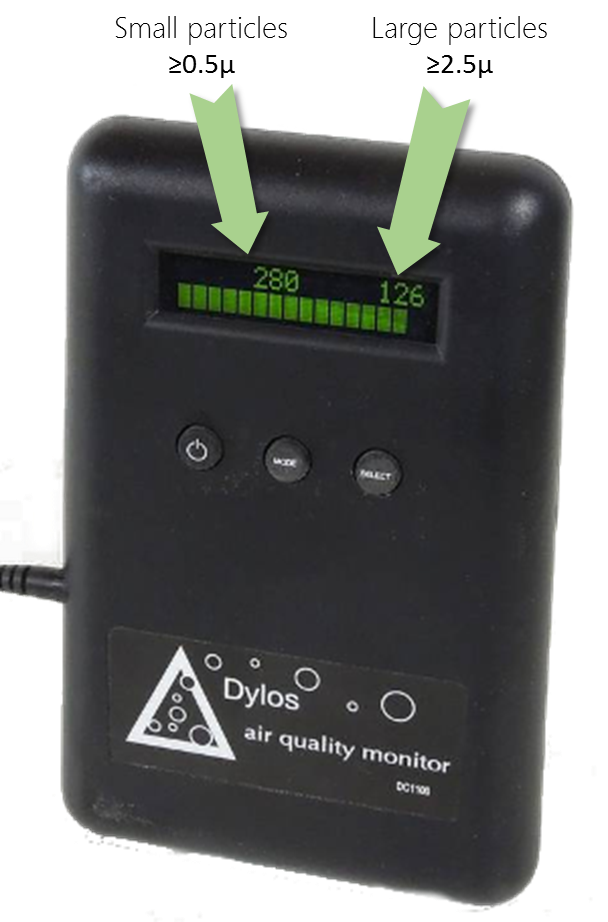
The Dylos Air Quality Sensor experiment

بانٹیں: aqicn.org/sensor/beijing/sanlitun/ur/

Introduction

For more information about those real-time dylos and BAM monitor PM2.5 and PM10 readings, please refer to our article on the Dylos Air Particule Counter experimentation.

If you want to know about other affordarable Air Quality Sensors such as Shinyei and Samyoung, check our sensor overview page.

Real-time data

Current dylos readings are: Particules larger than 0.5 is -, larger than 2.5 is -, updated on - - (China time).

Those values are expressed in number of particules per 0.01 cubic foot (100.n/ft3), i.e. same as what is displayed on the Dylos LCD.

Time series graphs

The following two graphs show the last 30 days data correlation for the Beijng Sanlitun Dylos monitor (in blue) and Beijing Chaoyang Agricultural Exhibition Hall (朝阳农展馆) BAM monitor (in red).

Note that the comparison between Dylos and BAM readings is done for Dylos ≥ 0.5u with PM2.5 and Dylos ≥ 2.5u with PM10. You might think that comparing readings for Dylos ≥ 2.5u and PM2.5 might be more relevant, but this is actually not the case. The explanation is given in the experiment ' what is the dylos monitor actually measuring'.


Variation between stations

The next 2 graphics show the PM2.5 and PM10 raw values (in µg/m3) for different BAM stations (i.e. without the Dylos values) in Beijing, for the last 10 days. This is provided to ensure that there is not significant devitation between the various stations, especially considering that some are located on the road side, while others are in the living area.

CAC Chaoyang Agritculture Center (朝阳农展馆), BAM PM.25 in µg/m3
COSC Chaoyang Olympic Sports Center (朝阳奥体中心), BAM PM2.5 in µg/m3
DCDS Dongcheng Dongsi (东城东四), BAM PM2.5 in µg/m3
US Emb US Embassy (美国大使馆), BAM PM2.5 in µg/m3


- -

For the list of all air quality sensors, check the Sensor Overview page

Read or publish comments (they rely on Disqus)

ہوا کے معیار اور آلودگی کی پیمائش کے بارے میں:

ہوا کے معیار کی سطح کے بارے میں

- ایئر کوالٹی انڈیکس (AQI) اقدارصحت کی تشویش کی سطح
0 - 50 اچھی ہوا کے معیار کو تسلی بخش سمجھا جاتا ہے، اور ہوا آلودگی سے کم یا کوئی خطرہ ہوتا ہے
51 -100 معتدل فضائی معیار قابل قبول ہے؛ تاہم، بعض آلودگیوں کے لئے وہاں بہت کم تعداد میں لوگوں کے لئے اعتدال پسند صحت کی تشویش ہو سکتی ہے جو فضائی آلودگی سے غیر معمولی حساس ہیں.
101-150 حساس افراد کیلئے غیر صحتمند حساس گروپوں کے ارکان صحت کے اثرات کا تجربہ کرسکتے ہیں. عام عوام کو متاثر نہیں ہونے کا امکان ہے.
151-200 مضر صحت ہر کوئی صحت کے اثرات کا سامنا کرنا شروع کر سکتا ہے؛ حساس گروہوں کے ارکان زیادہ سنجیدہ صحت کے اثرات کا تجربہ کرسکتے ہیں
201-300 انتہائی مضر صحت انتباہ صحت برائے ہنگامی حالات. پوری آبادی متاثر ہونے کا امکان ہے
300+ خطرناک صحت کی انتباہ: ہر ایک کی صحت کو زیادہ سنگین اثرات کا سامنا کر نا پڑ سکتا ہے

ہوا کے معیار اور آلودگی کے بارے میں مزید جاننے کے لیے، ویکیپیڈیا ایئر کوالٹی کا موضوع یا ایئر کوالٹی اور آپ کی صحت کے لیے ایئرنو گائیڈ دیکھیں۔

بیجنگ کے ڈاکٹر رچرڈ سینٹ سائر ایم ڈی کے صحت سے متعلق بہت مفید مشوروں کے لیے، www.myhealthbeijing.com بلاگ دیکھیں۔


استعمال کی اطلاع: اشاعت کے وقت تمام ایئر کوالٹی کے اعداد وشمار غیرتصدیق شدہ ھیں ، اور معیار کی یقین دہانی کے باعث ان اعداد و شمار کو بغیراطلاع ترمیم کیا جا سکتا ہے، کسی نوٹس کے بغیر. ورلڈ ایئر کوالٹی انڈیکس نے اس معلومات کے مضامین کو مرتب کرنے میں تمام معقول مہارت اور دیکھ بھال کا استعمال کیا ہے اور کسی بھی حالت میں نہیں ورلڈ ایئر کوالٹی انڈیکس پروجیکٹ ٹیم یا اس کے ایجنٹوں کو اس ڈیٹا کی فراہمی سے براہ راست یا غیر مستقیم طور پر پیدا کسی بھی نقصان، چوٹ یا نقصان کے لئے معاہدے، تشدد یا دوسری صورت میں ذمہ دار ہوسکتا ہے.


Settings


Language Settings:


Temperature unit:
Celcius