The Dylos Air Quality Sensor experiment

Membagikan: aqicn.org/sensor/beijing/sanlitun/id/

Introduction

For more information about those real-time dylos and BAM monitor PM2.5 and PM10 readings, please refer to our article on the Dylos Air Particule Counter experimentation.

If you want to know about other affordarable Air Quality Sensors such as Shinyei and Samyoung, check our sensor overview page.

Data waktu nyata

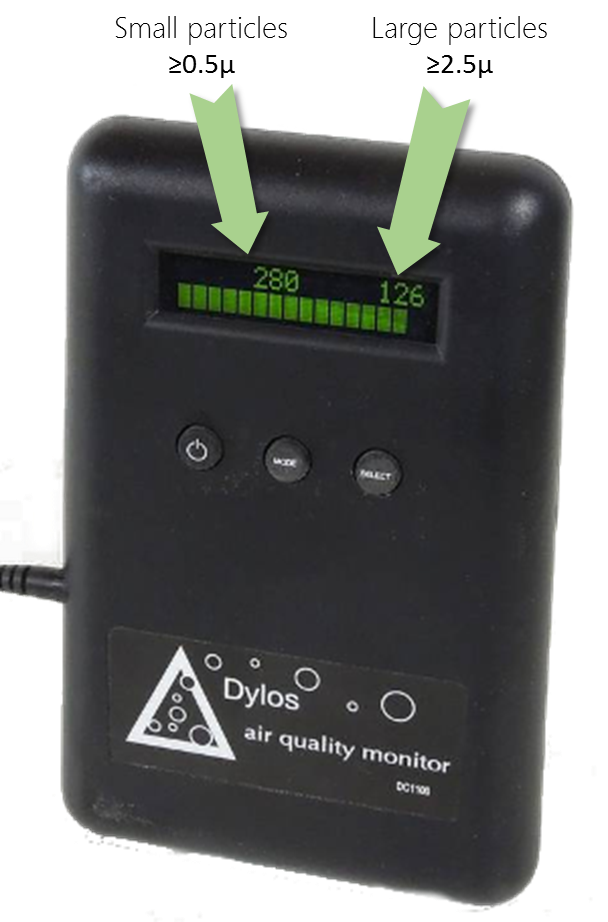
Current dylos readings are: Particules larger than 0.5 is -, larger than 2.5 is -, updated on - - (China time).

Those values are expressed in number of particules per 0.01 cubic foot (100.n/ft3), i.e. same as what is displayed on the Dylos LCD.

Time series graphs

The following two graphs show the last 30 days data correlation for the Beijng Sanlitun Dylos monitor (in blue) and Beijing Chaoyang Agricultural Exhibition Hall (朝阳农展馆) BAM monitor (in red).

Note that the comparison between Dylos and BAM readings is done for Dylos ≥ 0.5u with PM2.5 and Dylos ≥ 2.5u with PM10. You might think that comparing readings for Dylos ≥ 2.5u and PM2.5 might be more relevant, but this is actually not the case. The explanation is given in the experiment ' what is the dylos monitor actually measuring'.


Variation between stations

The next 2 graphics show the PM2.5 and PM10 raw values (in µg/m3) for different BAM stations (i.e. without the Dylos values) in Beijing, for the last 10 days. This is provided to ensure that there is not significant devitation between the various stations, especially considering that some are located on the road side, while others are in the living area.

CAC Chaoyang Agritculture Center (朝阳农展馆), BAM PM.25 in µg/m3
COSC Chaoyang Olympic Sports Center (朝阳奥体中心), BAM PM2.5 in µg/m3
DCDS Dongcheng Dongsi (东城东四), BAM PM2.5 in µg/m3
US Emb US Embassy (美国大使馆), BAM PM2.5 in µg/m3


- -

For the list of all air quality sensors, check the Sensor Overview page

Read or publish comments (they rely on Disqus)

Tentang Pengukuran Kualitas dan Polusi Udara:

Tentang Tingkat Kualitas Udara

- Nilai Indeks Kualitas Udara (AQI).Tingkat Kekhawatiran Kesehatan
0 - 50 Baik Kualitas udara dianggap memuaskan, dan polusi udara menimbulkan sedikit atau tanpa risiko
51 -100 Moderat Kualitas udara dapat diterima; Namun, untuk beberapa polutan mungkin ada kekhawatiran kesehatan yang moderat untuk sejumlah kecil orang yang sangat sensitif terhadap polusi udara.
101-150 Tidak Sehat untuk kelompok orang yang sensitif Anggota kelompok sensitif dapat mengalami efek kesehatan. Masyarakat umum tidak mungkin terpengaruh.
151-200 Tidak sehat Setiap orang mungkin mulai mengalami efek kesehatan; anggota kelompok sensitif dapat mengalami efek kesehatan yang lebih serius
201-300 Sangat Tidak Sehat Peringatan kesehatan untuk kondisi darurat. Seluruh penduduk lebih mungkin terpengaruh.
300+ Berbahaya Peringatan kesehatan: semua orang mungkin mengalami efek kesehatan yang lebih serius

Untuk mengetahui lebih banyak tentang Kualitas dan Polusi Udara, lihat topik Kualitas Udara di wikipedia atau panduan airnow tentang Kualitas Udara dan Kesehatan Anda .

Untuk nasihat kesehatan yang sangat berguna dari Dokter Beijing Richard Saint Cyr MD, periksa blog www.myhealthbeijing.com .


Pemberitahuan Penggunaan: Semua data Kualitas Udara tidak divalidasi pada saat publikasi, dan demi jaminan kualitas maka data ini dapat diubah, tanpa pemberitahuan, kapan saja. Proyek Indeks Kualitas Udara Dunia telah menerapkan semua kemampuan dan kepedulian yang cukup dalam mengumpulkan isi informasi ini dan dalam keadaan apa pun World Air Quality Index tim proyek atau agennya bertanggung jawab dalam kontrak, gugatan atau jika ada kerugian, cedera atau kerusakan yang timbul secara langsung atau tidak langsung dari pasokan data ini.


Settings


Language Settings:


Temperature unit:
Celcius