The Dylos Air Quality Sensor experiment

يشارك: aqicn.org/sensor/beijing/sanlitun/ar/

Introduction

For more information about those real-time dylos and BAM monitor PM2.5 and PM10 readings, please refer to our article on the Dylos Air Particule Counter experimentation.

If you want to know about other affordarable Air Quality Sensors such as Shinyei and Samyoung, check our sensor overview page.

معلومات الوقت الحقيقي

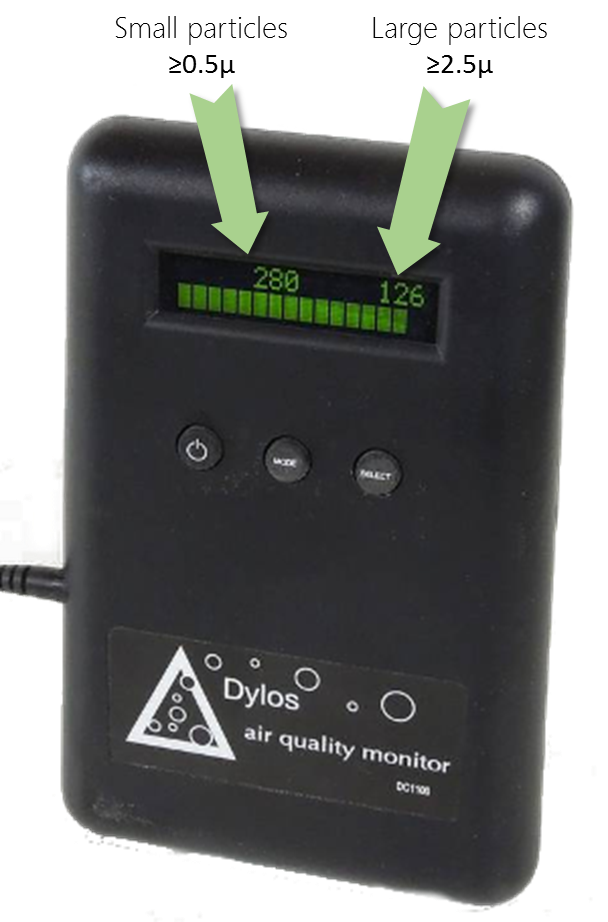
Current dylos readings are: Particules larger than 0.5 is -, larger than 2.5 is -, updated on - - (China time).

Those values are expressed in number of particules per 0.01 cubic foot (100.n/ft3), i.e. same as what is displayed on the Dylos LCD.

Time series graphs

The following two graphs show the last 30 days data correlation for the Beijng Sanlitun Dylos monitor (in blue) and Beijing Chaoyang Agricultural Exhibition Hall (朝阳农展馆) BAM monitor (in red).

Note that the comparison between Dylos and BAM readings is done for Dylos ≥ 0.5u with PM2.5 and Dylos ≥ 2.5u with PM10. You might think that comparing readings for Dylos ≥ 2.5u and PM2.5 might be more relevant, but this is actually not the case. The explanation is given in the experiment ' what is the dylos monitor actually measuring'.


Variation between stations

The next 2 graphics show the PM2.5 and PM10 raw values (in µg/m3) for different BAM stations (i.e. without the Dylos values) in Beijing, for the last 10 days. This is provided to ensure that there is not significant devitation between the various stations, especially considering that some are located on the road side, while others are in the living area.

CAC Chaoyang Agritculture Center (朝阳农展馆), BAM PM.25 in µg/m3
COSC Chaoyang Olympic Sports Center (朝阳奥体中心), BAM PM2.5 in µg/m3
DCDS Dongcheng Dongsi (东城东四), BAM PM2.5 in µg/m3
US Emb US Embassy (美国大使馆), BAM PM2.5 in µg/m3


- -

For the list of all air quality sensors, check the Sensor Overview page

Read or publish comments (they rely on Disqus)

حول جودة الهواء وقياس التلوث:

حول مستويات جودة الهواء

- قيم مؤشر جودة الهواء (AQI).مستويات الاهتمام بالصحة
0 - 50 جيد وتعتبر جودة الهواء مرضية ، كما أن تلوث الهواء لا يشكل خطراً يُذكر
51 -100 معتدل جودة الهواء مقبولة. ومع ذلك ، فبالنسبة لبعض الملوثات قد يكون هناك قلق صحي معتدل لعدد قليل جداً من الأشخاص الذين لديهم حساسية غير عادية لتلوث الهواء.
101-150 غير صحي للمجموعات الحساسة قد يواجه أعضاء المجموعات الحساسة آثارًا صحية. من غير المحتمل أن يتأثر عامة الناس.
151-200 غير صحي قد يعاني معظم الناس من الآثار الجانبية التي تؤثر على الصحة؛ أما الأفراد الذين لديهم وضع صحي حساس فقد يعانون من مشاكل صحية خطيرة
201-300 غير صحي للغاية تحذيرات صحية لظروف الطوارئ. من المرجح أن يتأثر جميع السكان.
300+ خطير تنبيه صحي: قد يعاني الجميع من آثار صحية أكثر خطورة

لمعرفة المزيد عن جودة الهواء والتلوث، راجع موضوع جودة الهواء في ويكيبيديا أو دليل airnow لجودة الهواء وصحتك .

للحصول على نصائح صحية مفيدة للغاية من طبيب بكين ريتشارد سانت سير، قم بزيارة مدونة www.myhealthbeijing.com .


إشعار الاستخدام: جميع بيانات جودة الهواء غير مضمونة في وقت النشر ، وبسبب ضمان الجودة ، يمكن تعديل هذه البيانات ، دون سابق إنذار ، في أي وقت. لقد مارس مشروع مؤشر جودة الهواء العالمي جميع المهارات والحلول المعقولة في تجميع محتويات هذه المعلومات ولن يكون تحت أي ظرف من الظروف فريق مشروع جودة الهواء العالمي أو وكلائه مسؤولين في العقد أو الضرر أو غير ذلك عن أي خسارة أو ضرر أو ضرر ناشئ بشكل مباشر أو غير مباشر عن توريد هذه البيانات.


Settings


Language Settings:


Temperature unit:
Celcius