The Dylos Air Quality Sensor experiment

Deel: aqicn.org/sensor/beijing/sanlitun/nl/

Introduction

For more information about those real-time dylos and BAM monitor PM2.5 and PM10 readings, please refer to our article on the Dylos Air Particule Counter experimentation.

If you want to know about other affordarable Air Quality Sensors such as Shinyei and Samyoung, check our sensor overview page.

Realtime gegevens

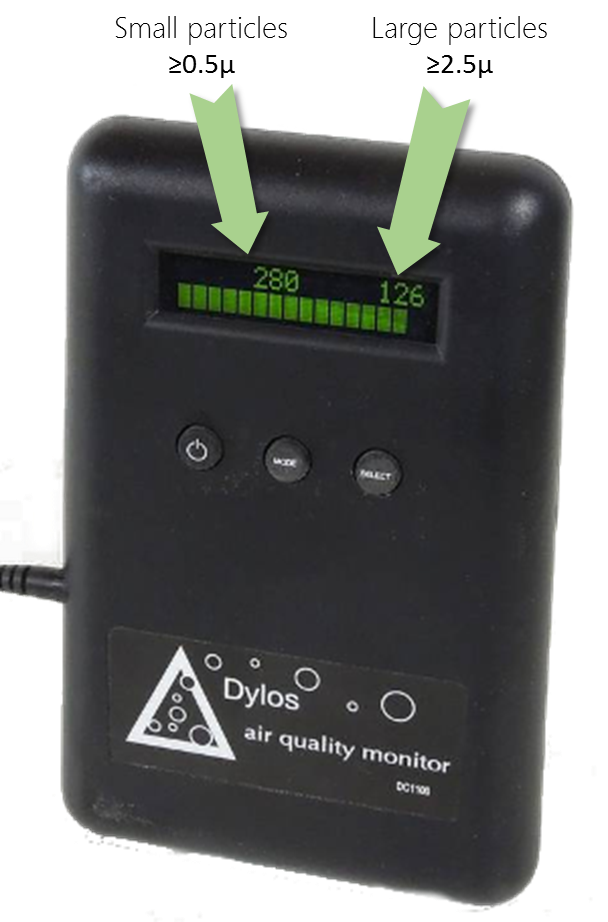
Current dylos readings are: Particules larger than 0.5 is -, larger than 2.5 is -, updated on - - (China time).

Those values are expressed in number of particules per 0.01 cubic foot (100.n/ft3), i.e. same as what is displayed on the Dylos LCD.

Time series graphs

The following two graphs show the last 30 days data correlation for the Beijng Sanlitun Dylos monitor (in blue) and Beijing Chaoyang Agricultural Exhibition Hall (朝阳农展馆) BAM monitor (in red).

Note that the comparison between Dylos and BAM readings is done for Dylos ≥ 0.5u with PM2.5 and Dylos ≥ 2.5u with PM10. You might think that comparing readings for Dylos ≥ 2.5u and PM2.5 might be more relevant, but this is actually not the case. The explanation is given in the experiment ' what is the dylos monitor actually measuring'.


Variation between stations

The next 2 graphics show the PM2.5 and PM10 raw values (in µg/m3) for different BAM stations (i.e. without the Dylos values) in Beijing, for the last 10 days. This is provided to ensure that there is not significant devitation between the various stations, especially considering that some are located on the road side, while others are in the living area.

CAC Chaoyang Agritculture Center (朝阳农展馆), BAM PM.25 in µg/m3
COSC Chaoyang Olympic Sports Center (朝阳奥体中心), BAM PM2.5 in µg/m3
DCDS Dongcheng Dongsi (东城东四), BAM PM2.5 in µg/m3
US Emb US Embassy (美国大使馆), BAM PM2.5 in µg/m3


- -

For the list of all air quality sensors, check the Sensor Overview page

Read or publish comments (they rely on Disqus)

Over de luchtkwaliteit- en vervuilingsmeting:

Over de luchtkwaliteitsniveaus

- Luchtkwaliteitsindex (AQI)-waardenNiveaus van gezondheidsproblemen
0 - 50 Goed Luchtkwaliteit wordt als bevredigend beschouwd en luchtverontreiniging vormt weinig of geen risico
51 -100 Matig Luchtkwaliteit is acceptabel; voor sommige verontreinigende stoffen kan er echter sprake zijn van een matige gezondheidsrisico voor een zeer klein aantal mensen dat ongewoon gevoelig is voor luchtvervuiling.
101-150 Ongezond voor gevoelige groepen Leden van gevoelige groepen kunnen gezondheidseffecten ervaren. Het grote publiek zal waarschijnlijk niet worden beïnvloed.
151-200 Ongezond Iedereen kan gezondheidseffecten ervaren; leden van gevoelige groepen kunnen ernstiger gezondheidseffecten ervaren
201-300 Zeer Ongezonde Gezondheidswaarschuwingen voor noodomstandigheden. De volledige populatie is mogelijk getroffen.
300+ gevaarlijk Gezondheidswaarschuwing: iedereen kan ernstigere gezondheidseffecten ervaren

Als u meer wilt weten over luchtkwaliteit en vervuiling, raadpleegt u het Wikipedia-onderwerp Luchtkwaliteit of de airnow-gids voor luchtkwaliteit en uw gezondheid .

Voor zeer nuttige gezondheidsadviezen van de Beijing-arts Richard Saint Cyr MD, kijk op de blog www.myhealthbeijing.com .


Gebruiksmelding: Alle gegevens van de luchtkwaliteit zijn niet-gevalideerd op het moment van publicatie en als gevolg van kwaliteitsborging kunnen deze gegevens op elk gewenst moment zonder voorafgaande kennisgeving worden gewijzigd. Het World Air Quality Index -project heeft alle redelijke vaardigheid en zorg besteed aan het samenstellen van de inhoud van deze informatie en onder geen enkele voorwaarde zal de World Air Quality Index projectteam of zijn agenten zijn aansprakelijk in contract, onrechtmatige daad of anderszins voor enig verlies, letsel of schade die direct of indirect voortvloeit uit de levering van deze gegevens.


Settings


Language Settings:


Temperature unit:
Celcius