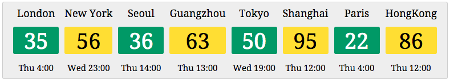
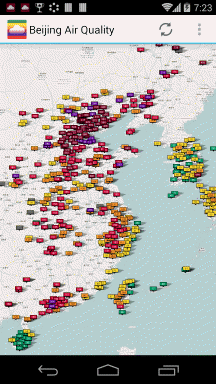
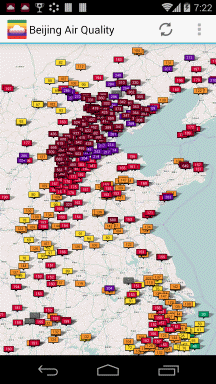
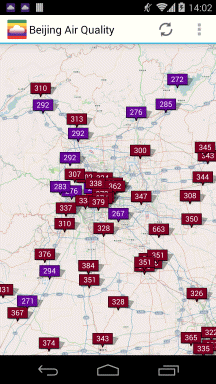
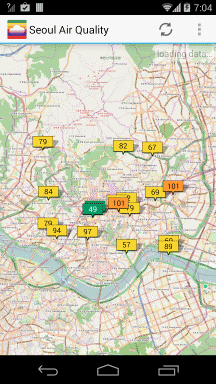
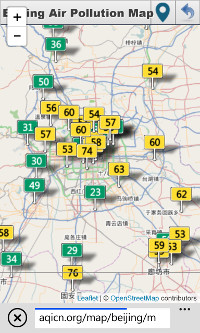
क्या आप सोच रहे हैं कि नीचे दिए गए विभिन्न रंगों और संख्याओं का क्या मतलब है?
संख्याएं वायु गुणवत्ता सूचकांक हैं, जो 0 (अच्छा) से 500 (खराब) के पैमाने पर आधारित हैं। रंग विभिन्न स्वास्थ्य प्रभाव श्रेणियों (अच्छा, मध्यम, अस्वास्थ्यकर... खतरनाक) के अनुरूप हैं।
(credits)
2008 में, जब विश्व वायु गुणवत्ता परियोजना शुरू हुई, सभी मौजूदा वायु गुणवत्ता निगरानी स्टेशन अत्यधिक पेशेवर और महंगी BAM और TOEM तकनीक पर आधारित थे। इस प्रकार के स्टेशनों का रखरखाव हमेशा पेशेवर और उच्च योग्य ऑपरेटरों द्वारा किया जाता है - और यह सुनिश्चित करता है कि इस स्टेशन के आउटपुट पर भरोसा किया जा सकता है।
12 साल बाद, BAM और TOEM स्टेशन अभी भी मौजूद हैं। लेकिन लेजर स्कैटरिंग तकनीक और कम लागत वाले धूल सेंसर के विकास के साथ, बीएएम और टीओईएम स्टेशनों की संख्या अब विशाल और घने कम लागत वाले सेंसर नेटवर्क से अधिक हो गई है। आजकल, उनमें से बहुत सारे नेटवर्क हैं - कुछ के नाम बताएं: उड़द, लूफ़्ट-डेटन, एयरको, एयरबीजी, ओपनसेंस, यक्कॉ, ईकोनेट, एयरकाज़, सीसीडीसी, एम्बेंटे, ग्रीन एयर, आदि।
Univ. of Arizona (credits)
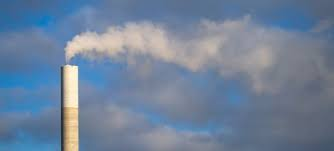
एक सामान्य प्रश्न पूछा जाता है कि नाइट्रोजन डाइऑक्साइड ( NO2 ), सल्फर डाइऑक्साइड ( SO2 ) और कार्बन मोनोऑक्साइड (CO) की सांद्रता हमेशा इतनी कम क्यों होती है और क्या उन्हें मापना उपयोगी है?
इन पदार्थों की निगरानी के महत्व पर प्रकाश डालने के लिए यह लेख यह बताएगा कि ये प्रदूषक कहां से आते हैं और वे हमारे स्वास्थ्य और पर्यावरण को कैसे प्रभावित करते हैं।
चीजों को संक्षिप्त रखने के लिए यह लेख केवल NO2 पर केंद्रित होगा।
Univ. of Arizona (credits)
यूएस ईपीए द्वारा ओजोन 8 घंटे के ब्रेकप्वाइंट के लिए अपने AQI मानक को अपडेट किए हुए कई महीने हो चुके हैं . यह निश्चित रूप से संयुक्त राज्य अमेरिका में वायु गुणवत्ता को मजबूत करने की दिशा में एक सकारात्मक कदम है, क्योंकि अमेरिकी ईपीए मानक वास्तव में ओजोन के लिए सबसे कम रूढ़िवादी मानकों में से एक था, उदाहरण के लिए, भारत, चीन या यूरोप में समान मानकों की तुलना में!
लेकिन अधिक दिलचस्प बात यह है कि एयरनाउ ने हाल ही में ओजोन नाउकास्ट फॉर्मूला पेश करके एक कदम आगे बढ़ाया है, जो 1 घंटे के ब्रेकपॉइंट के स्थान पर भारित 8 घंटे के ब्रेकपॉइंट मानक का उपयोग करने की अनुमति देता है। यह परिवर्तन, जिसके बारे में AirNow टीम ने जनता को व्यापक रूप से सूचित नहीं किया, ओजोन AQI की रिपोर्ट करने के तरीके में काफी बदलाव लाता है, और यही हम इस लेख में देखेंगे।

पिछले महीनों के दौरान, विश्व वायु गुणवत्ता टीम कई नए वायु गुणवत्ता पूर्वानुमान मॉडलों का विश्लेषण करने के साथ-साथ वायु गुणवत्ता पूर्वानुमान मॉडल प्रदर्शक में सुधार करने पर काम कर रही है।
यह लेख नवीनतम पूर्वानुमान मॉडल प्रदर्शक प्रस्तुत करेगा, जो विश्व की ग्रिडेड जनसंख्या ( जीपीडब्ल्यू ) पर आधारित है, और जिसे उत्तरी भारत क्षेत्र (बांग्लादेश, पाकिस्तान और नेपाल सहित) के लिए वायु गुणवत्ता पूर्वानुमान का विश्लेषण करने के लिए लागू किया जाएगा।
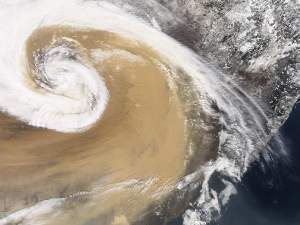
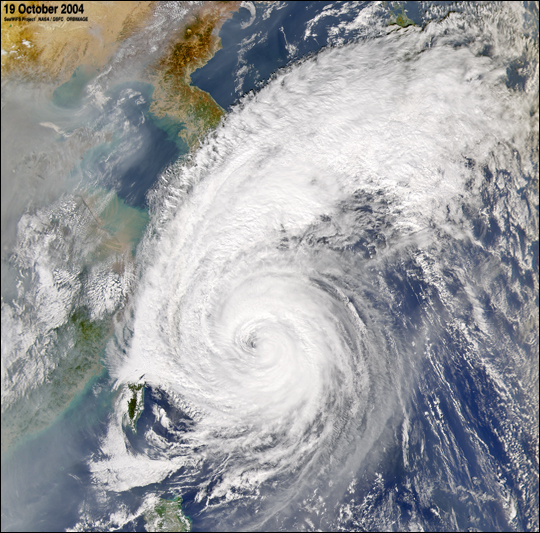
हम वायु प्रदूषण पर हवा के प्रभाव के बारे में कई बार लिखते रहे हैं, और कैसे तेज हवाएं (या, अधिक सटीक रूप से कहें तो, मजबूत वेंटिलेशन ) बहुत कम समय में हवा को साफ करने में मदद कर सकती हैं। लेकिन हमें कभी भी इस घटना का गतिशील दृश्य बनाने का अवसर नहीं मिला, इसलिए यह लेख इसी बारे में लिखेगा।
लगभग दो महीने हो गए हैं जब यूएनईपी के हमारे सहयोगी इस विचार को बढ़ावा देने की दिशा में एक दिलचस्प कदम उठा रहे हैं कि वायु गुणवत्ता संयुक्त राष्ट्र के भीतर किसी भी अन्य व्यवसाय की तरह ही महत्वपूर्ण है। उन्होंने इस क्षेत्र में निवेश करना शुरू किया, और किफायती वायु गुणवत्ता निगरानी स्टेशनों के लिए एक खुला पदचिह्न बनाने की उत्कृष्ट पहल की।
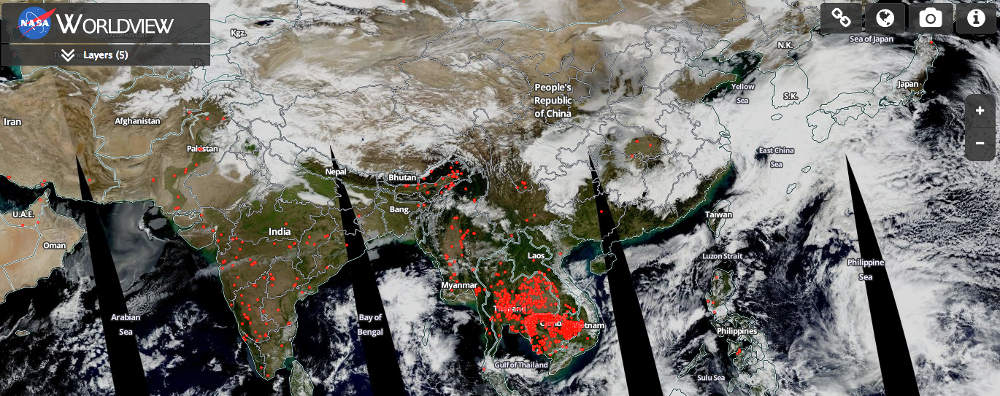
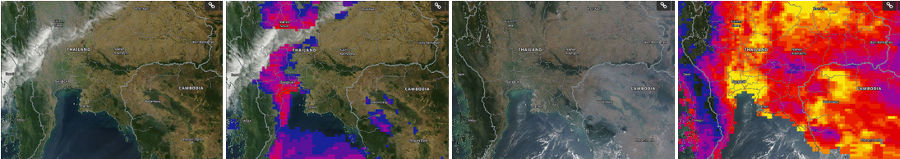
यह दक्षिण एशिया में धुंध की इस भारी अवधि के दौरान एएसएमसी - आसियान विशिष्ट मौसम विज्ञान केंद्र ( asmc.asean.org ) के लिए विश्व वायु गुणवत्ता सूचकांक परियोजना का एक छोटा सा योगदान है।
हम हाल ही में दुनिया भर में कुछ और ईपीए (पर्यावरण संरक्षण एजेंसियों) के साथ सहयोग कर रहे हैं। हमारे द्वारा किए गए सभी अनुरोधों में से, यह वास्तव में एक वेब मानचित्र सेवा प्रदान करना है ताकि ईपीए स्वयं अपनी वेबसाइट से मानचित्र पर वास्तविक समय वायु गुणवत्ता डेटा शामिल कर सके।
हमारी ओर से ऐसी मानचित्र वेब सेवा का उपयोग करने के स्पष्ट लाभों में से एक सीमा-पार डेटा से लाभ प्राप्त करना है जिसे हम क्यूरेट कर रहे हैं, यानी विश्वव्यापी वायु गुणवत्ता की जानकारी देश की सीमा सीमा के बिना प्रदान की जाती है।
दूसरा लाभ न केवल यह है कि यह एक निःशुल्क सेवा है, बल्कि यह गूगल, बिंग या लीफलेट की मानक मानचित्र प्रौद्योगिकियों के साथ भी पूरी तरह से संगत है, जो किसी भी मौजूदा वेबसाइट के साथ त्वरित और आसान एकीकरण की अनुमति देता है।
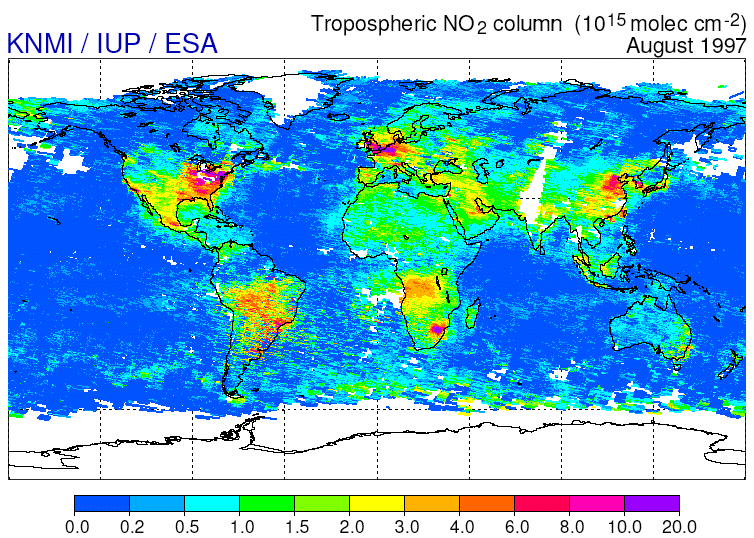
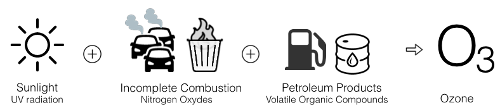
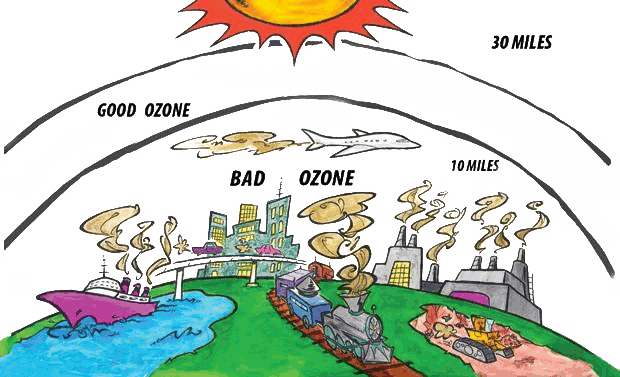
परिवेशी ओजोन , जिसे O3 कहा जाता है और इसे जमीनी स्तर या क्षोभमंडलीय ओजोन भी कहा जाता है, देश की परवाह किए बिना पृथ्वी पर सभी को प्रभावित करता है, जैसा कि दाईं ओर की छवि में दिखाया गया है। .
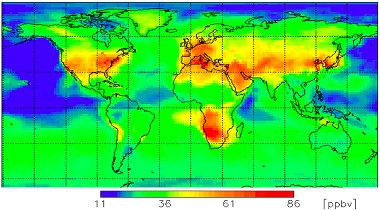
(Attribution: WMO GAW research on reactive gases )
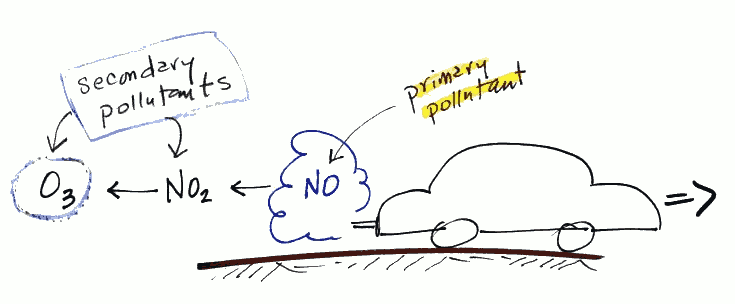
पार्टिकुलेट मैटर (पीएम 2.5 ) के विपरीत, जमीनी स्तर का ओजोन सीधे उत्सर्जित नहीं होता है। इसके बजाय यह नाइट्रोजन ऑक्साइड, वाष्पशील कार्बनिक यौगिकों, सूर्य के प्रकाश और उच्च तापमान की उपस्थिति में होने वाली रासायनिक प्रतिक्रियाओं की एक श्रृंखला के माध्यम से उत्पन्न होता है, जैसा कि निम्नलिखित दृश्य में दिखाया गया है:
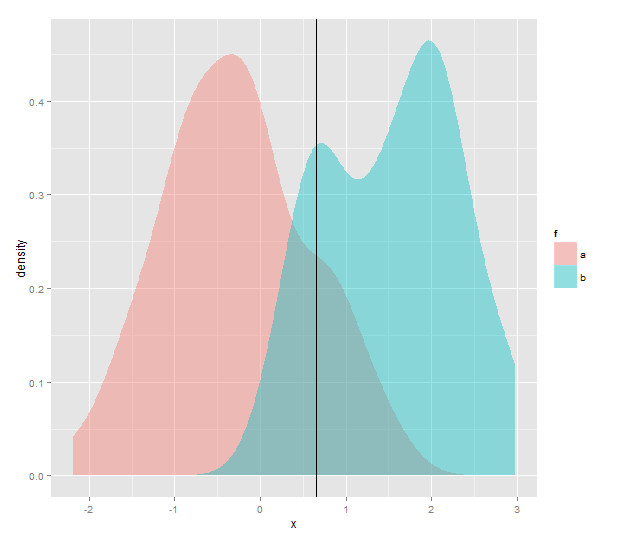
स्वास्थ्य पर इस जमीनी स्तर के ओजोन के प्रभाव की मात्रा निर्धारित करना वायु गुणवत्ता सूचकांक मानक के माध्यम से किया जाता है जिसे प्रत्येक देश परिभाषित करता है। दिलचस्प बात यह है कि आधी दुनिया मिलीग्राम माप पर आधारित मानक का उपयोग कर रही है, जबकि बाकी पीपीबी आधारित माप का उपयोग कर रही है। लेकिन क्या ये वाकई एक समस्या है? इस लेख में हम यही देखेंगे।

Inspekcja Ochrony Środowiska.
(Inspection of Environmental Protection)
पोलैंड के लिए वायु गुणवत्ता डेटा कुछ समय से उपलब्ध है, लेकिन हमें हाल ही में इंस्पेकजा ओक्रोनी श्रोडोविस्का , यानी पर्यावरण संरक्षण के क्षेत्रीय निरीक्षणों द्वारा उपयोग किए जाने वाले AQI पैमाने के बारे में कुछ प्रश्न मिले हैं, और यह विश्व वायु पर उपयोग किए जाने वाले पैमाने से कैसे भिन्न है। गुणवत्ता सूचकांक परियोजना. उनमें से एक सिल्विया से है, जिसने पूछा:
मैं उन सभी नंबरों को लेकर भ्रमित हूं, और वारसॉ ईपीए वेबसाइट पर दिखाए गए नंबरों में अंतर क्यों है।
क्या आप कृपया मुझे वारसॉ में डेटा के स्रोत और आपके द्वारा प्रदान किए गए डेटा की विश्वसनीयता के बारे में सूचित कर सकते हैं?
यह वास्तव में एक बहुत अच्छा सवाल है, क्योंकि, जब डेटा की बात आती है, तो किसी को भी डेटा को "अनुदत्त" नहीं मानना चाहिए ('अपने शरीर के डेटा का मालिक बनें' पर टैलिथिया विलियम्स की उत्कृष्ट TED वार्ता का संदर्भ देते हुए)। यही कारण है कि विश्व वायु गुणवत्ता सूचकांक परियोजना मौजूद है, यानी हर किसी को यह समझाने के लिए कि वायु प्रदूषण के पीछे की संख्या को कैसे समझा जाए।
बाहरी वेबसाइटों के भीतर हमारे AQI विजेट्स के एकीकरण को बेहतर बनाने के लिए, हमने एक नया विजेट एपीआई फ़ीड विकसित किया है। मौजूदा विजेट फ़ीड की तुलना में, यह नया एपीआई फ़ीड एकीकरण के लिए बहुत अधिक लचीलापन प्रदान करता है, लेकिन विजेट उपस्थिति को अनुकूलित करने के लिए कई और विकल्प भी प्रदान करता है।
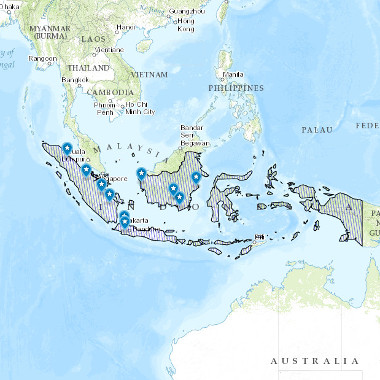
इंडोनेशिया के लिए वास्तविक समय वायु गुणवत्ता डेटा अब उपलब्ध है। इंडोनेशिया भर के प्रमुख शहरों में स्थित 10 स्टेशन वास्तविक समय में पीएम 10 प्रदूषण को माप रहे हैं।
मॉनिटरिंग स्टेशन इंडोनेशियाई मौसम विज्ञान, जलवायु विज्ञान और भूभौतिकी विभाग बीएमकेजी ( बदन मेटियोरोलॉजी क्लिमेटोलोजी डान जियोफिसिका ) द्वारा संचालित किए जाते हैं।

मॉन्ट्रियल और क्यूबेक के लिए वायु गुणवत्ता डेटा कुछ समय से उपलब्ध है, लेकिन हमें हाल ही में कनाडा के इस हिस्से में उपयोग किए जाने वाले AQI पैमाने के बारे में कुछ प्रश्न मिले हैं। उनमें से एक मैरी ए से है, जिन्होंने पूछा:
मैं जानना चाहूंगा कि आपकी वेबसाइट पर वायु गुणवत्ता सूचकांक मॉन्ट्रियल की वेबसाइट पर वायु गुणवत्ता सूचकांक से भिन्न क्यों है? क्या आप यूएस ईपीए एक्यूआई मानकों को पूरा करने के लिए किसी चीज़ की पुनर्गणना करते हैं? यदि हां, तो कैसे? किस डेटा से?
ये वाकई बहुत अच्छा सवाल है. और हम इस लेख में उपयोग में आने वाले विभिन्न पैमानों, पैमानों की एक-दूसरे से तुलना कैसे की जाती है और रूपांतरण कैसे किया जा सकता है, के बारे में बताएंगे।

विश्व वायु गुणवत्ता सूचकांक परियोजना समुदाय को धन्यवाद, पोलिश भाषा के अनुवाद अब वेबसाइट और वेब-एप्लिकेशन के लिए उपलब्ध हैं। उत्कृष्ट योगदान के लिए विशेष रूप से उपयोगकर्ता " AiRs " को बहुत-बहुत धन्यवाद।
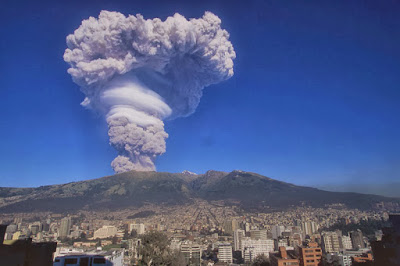
Guagua Pichincha volcano in Ecuador (Attribution)
बीजिंग के नागरिक लंबे समय से जानते हैं कि हवा में प्रदूषण को साफ करने का सबसे अच्छा प्राकृतिक तरीका उत्तर से आने वाली तेज हवाएं हैं, जबकि इसके विपरीत, दक्षिण से आने वाली हवाएं हेबै से अधिक प्रदूषण ला सकती हैं।
क्विटो , इक्वाडोर में भी ऐसी ही समस्या है, सिवाय इसके कि प्रदूषण सक्रिय ज्वालामुखियों से आता है। सौभाग्य से, वे इतनी बार फूटते नहीं हैं, लेकिन जब वे फूटते हैं, तो बेहतर होगा कि विस्फोटक विस्फोटों से बने भारी राख के बादल के नीचे रहने से बचें (चित्र देखें)।
हांगकांग ईपीए ने अपने वायु गुणवत्ता सूचकांक मानक को पारंपरिक वायु प्रदूषण सूचकांक से तथाकथित वायु गुणवत्ता स्वास्थ्य सूचकांक (एक्यूएचआई) में अद्यतन किए हुए काफी समय हो गया है, लेकिन गहराई से देखने के लिए हमें अब तक कभी कोई बदलाव नहीं मिला है। यह, जो हम इस लेख में करेंगे।
हांगकांग ईपीए ने वास्तव में यह समझाने में उत्कृष्ट काम किया है कि AQHI को कैसे परिभाषित किया जाता है, और AQHI को समझने के लिए जो जानकारी आवश्यक है वह उनकी वेबसाइट पर उपलब्ध है। सबसे स्पष्ट सरलीकरण पारंपरिक 0-500 सूचकांक को एक नई सरलीकृत 0-10 + रेंज में बदलना है, जिसे पांच स्वास्थ्य जोखिम श्रेणियों में उप-विभाजित किया गया है, जैसा कि नीचे दिखाया गया है:
| LOW | MODERATE | HIGH | VERY HIGH | SERIOUS | |||||||||||||||||
| | | | | 1 | 2 | 3 | 4 | 5 | 6 | 7 | 8 | 9 | 10 | 10+ | | ||||||
लेकिन वास्तव में एक सीमा सरलीकरण से कहीं अधिक है: नया AQHI अतिरिक्त स्वास्थ्य जोखिम (%AR) की बहुत ही चतुर अवधारणा को भी पेश कर रहा है, जिसे मूल रूप से 2007 में, दक्षिण अफ्रीका के चार भागीदारों की एक टीम द्वारा परिभाषित किया गया था, और सबसे पहले कनाडा में उपयोग किया जाता है।
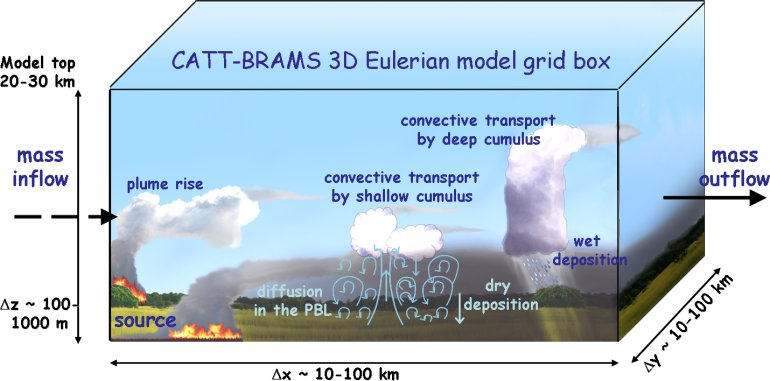
The Air Quality forecast for South America is now available on the World Air Quality Index project, in parnership with the Brazilian Centro de Previsão do Tempo e Estudos Climáticos (CPTEC). The forecast can be accessed freely accessed from cptec.inpe.br as well as forecast/ south-america/hi/.
The CPTEC team has done an excellent work at providing a simple and detailed explanation on the underlying concepts used by their forecast model, called BRAMS (for Brazilian developments on the Regional Atmospheric Modelling System). The picture below (from the CPTEC) is giving an insight on the workflow for their model (source -> transport -> deposition).
(Attribution: Houston Clean Air Network )
ग्राउंड ओजोन वायु गुणवत्ता सूचकांक गणना को इंस्टेंट कास्ट अवधारणा का पालन करने के लिए अद्यतन किया गया है, यानी पिछले घंटों के प्रदूषण के बजाय अभी प्रदूषण की रिपोर्ट करने के लिए। इंस्टेंट कास्ट के बारे में अधिक जानकारी के लिए कृपया इस लेख को देखें।
ओजोन सूचकांक की गणना अब पिछले 8 घंटे के औसत के बजाय प्रति घंटा रीडिंग का उपयोग कर रही है, लेकिन अभी भी 100 से नीचे AQI के लिए वही 8 घंटे AQI ब्रेकप्वाइंट फॉर्मूला लागू कर रही है। 8 घंटे की औसत सांद्रता की गणना के लिए पिछली प्रक्रिया का उपयोग नहीं किया जाता है त्वरित रिपोर्टिंग के लिए और भी कुछ। AQI 100 से ऊपर, सामान्य 1 घंटे के ओजोन ब्रेकप्वाइंट का उपयोग किया जाता है (जबकि पहले, 100 से ऊपर AQI को 1 घंटे और 8 घंटे की रीडिंग की अधिकतम सीमा के रूप में परिभाषित किया गया था)।

विश्व स्वास्थ्य संगठन द्वारा ' शहरों में परिवेशी (बाहरी) वायु प्रदूषण डेटाबेस 2014' जारी किए हुए एक वर्ष से अधिक समय हो चुका है। इस परियोजना पर काम करने वाली डब्ल्यूएचओ टीम ने इतने सारे देशों के लिए डेटा इकट्ठा करने और इसे सभी के लिए सुलभ एक ही स्थान पर रखने में उत्कृष्ट काम किया है।
हमने इसके बारे में अपने पिछले कई लेखों में लिखा है (जैसे अफ्रीका या लैटिन अमेरिका में वायु गुणवत्ता के लिए), लेकिन हमें कभी भी उनके डेटा सेट की कल्पना करने के लिए विभिन्न विकल्पों को देखने का मौका नहीं मिला। तो, हम इस लेख में इसी बारे में लिखेंगे।
(Tiranga, तिरंगा)
भारतीय केंद्रीय प्रदूषण नियंत्रण बोर्ड ने हाल ही में, अप्रैल 2015 में, भारत के राष्ट्रीय वायु गुणवत्ता सूचकांक मानक ( NAQI ) के प्रकाशन की घोषणा की है। इस मानक पर सभी विवरण सीपीसीबी , विकिपीडिया या भारतीय प्रौद्योगिकी संस्थान, कानपुर ( iitk.ac.in ) की इस रिपोर्ट से उपलब्ध हैं।
यह वास्तव में वायु गुणवत्ता विश्व जागरूकता में एक बहुत ही महत्वपूर्ण कदम है, क्योंकि प्रत्येक देश में वायु प्रदूषण देश के प्रदूषण प्रकार के लिए बहुत विशिष्ट है: उदाहरण के लिए धूल के कारण (अरबी प्रायद्वीप में), परिवहन के कारण (नई दिल्ली) या स्थलाकृति (चिली)।
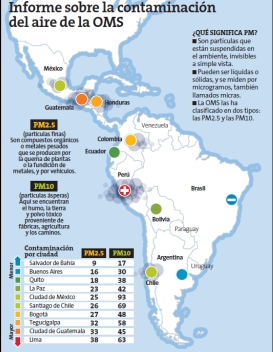
हमारी दुनिया के किसी भी अन्य महाद्वीप की तरह लैटिन अमेरिका भी वायु प्रदूषण का सामना कर रहा है। परिवेशी (बाहरी) वायु प्रदूषण पर विश्व स्वास्थ्य संगठन की हालिया 2014 की रिपोर्ट लैटिन अमेरिका के कई शहरों के लिए कुछ वार्षिक औसत आंकड़े देती है। आश्चर्य की बात नहीं, सबसे खराब स्थिति एशिया में है, लेकिन फिर भी, लैटिन अमेरिका के कुछ शहरों में भी उच्च सूचकांक हैं (बाईं ओर तालिका देखें)।
हालाँकि, WHO की रैंकिंग पर सावधानीपूर्वक विचार किया जाना चाहिए, विशेष रूप से इस्तेमाल की गई माप विधियों पर विचार करते हुए रिपोर्ट में तर्क दिया जा सकता है - उदाहरण के लिए, लीमा के लिए, पेरूवियन ईपीए तर्क दे रहा है कि WHO का डेटा सही नहीं है क्योंकि नमूने नहीं लिए गए थे सही स्थान (कई देशों से पूर्ण प्रतिक्रिया के लिए पी. एस्टुपिन्या का यह लेख पढ़ें)। यह वास्तव में इसी कारण से है कि हम विश्व वायु गुणवत्ता परियोजना पर केवल वास्तविक समय की जानकारी प्रकाशित करते हैं क्योंकि हमारा मानना है कि रैंकिंग से अधिक, यह वर्तमान स्थितियां हैं जो विश्व नागरिकों के लिए महत्वपूर्ण हैं।
(Jalur Gemilang)
मलेशिया के लिए वायु गुणवत्ता लंबे समय से उपलब्ध है, लेकिन अन्य देशों के विपरीत, केवल समग्र AQI प्रदान किया जाता है। पीएम 10 , ओजोन जैसे व्यक्तिगत प्रदूषकों के लिए AQI उपलब्ध नहीं है, जो यूएस ईपीए पैमाने पर रूपांतरण को और अधिक कठिन बना देता है।
सौभाग्य से, मलेशिया में उपयोग किए जाने वाले AQI पैमाने के बारे में जानकारी, जिसे एपीआई (वायु प्रदूषक सूचकांक के लिए) के रूप में भी जाना जाता है, को ' मलेशिया में वायु प्रदूषक सूचकांक के लिए एक गाइड ' दस्तावेज़ में स्पष्ट रूप से समझाया गया है।
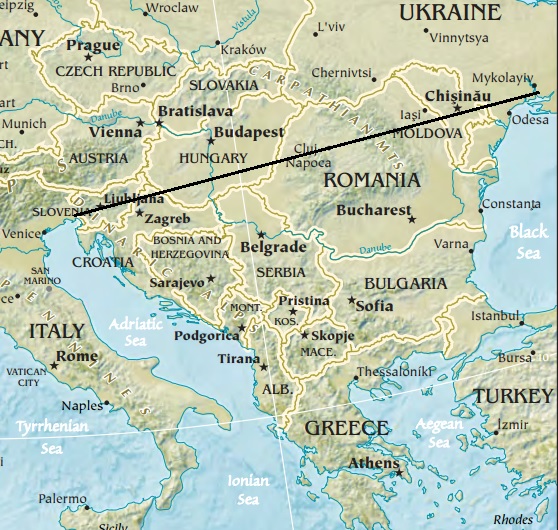
बाल्कन प्रायद्वीप, जिसे लोकप्रिय रूप से बाल्कन कहा जाता है, दक्षिणपूर्व यूरोप का एक भौगोलिक क्षेत्र है। इस क्षेत्र का नाम बाल्कन पर्वत से लिया गया है जो सर्बिया के पूर्व से बुल्गारिया के पूर्व में काला सागर तक फैला हुआ है।
बाल्कन के कई देश वास्तविक समय में वायु गुणवत्ता रीडिंग प्रदान कर रहे हैं। तुर्की (थ्रेस), रोमानिया और क्रोएशिया का डेटा विश्व वायु गुणवत्ता सूचकांक परियोजना पर लंबे समय से उपलब्ध है। आज, हम 3 नए देशों: सर्बिया , बुल्गारिया और मैसेडोनिया के लिए डेटा रोल-आउट करने में सक्षम हैं।

हमें नासा एप्लाइड रिमोट सेंसिंग ट्रेनिंग ( एआरएसईटी ) टीम से डॉ. पवन गुप्ता द्वारा पृथ्वी अवलोकन और वायु गुणवत्ता अनुप्रयोगों के लिए उपकरण वेबिनार में हमारे विश्व वायु गुणवत्ता सूचकांक परियोजना के बारे में एक प्रस्तुति देने के लिए आमंत्रित किए जाने का सम्मान मिला:

जब वायु गुणवत्ता के बारे में बात की जाती है, तो लोगों के दिमाग में सबसे पहले जो देश आते हैं, वे हैं चीन और भारत, और आमतौर पर एशिया। यहां तक कि विश्व वायु गुणवत्ता सूचकांक परियोजना पर भी, शुरू से ही एशिया पर हमारा विशेष ध्यान रहा है (संभवतः इसलिए क्योंकि यहीं हमारा मुख्यालय स्थित है!)।
कुछ साल पहले, 2012 में, हमने अन्य सात महाद्वीपों को कवर करने के लिए अपना दायरा बढ़ाने का फैसला किया, जिसकी शुरुआत ओशिनिया से हुई और फिर यूरोप और उत्तरी अमेरिका , दक्षिण अमेरिका तक।
लेकिन सात महाद्वीपों में से एक, अर्थात् अफ़्रीका , आश्चर्यजनक रूप से पीछे रह गया है। डेटा की इस कमी के बारे में हमें कई पूछताछ मिलीं, और आखिरी में से एक सईद ई. का था, जिन्होंने लिखा:
विश्व वायु गुणवत्ता सूचकांक परियोजना स्थल बनाने के लिए धन्यवाद। यह बहुत उपयोगी जानकारी देता है.
मेरी एकमात्र चिंता यह है कि अफ्रीका पर विचार क्यों नहीं किया जाता।
जानकारी के लिए मैं मोरक्को का नागरिक हूं।
")
STRONG LAPSE CONDITION (LOOPING)
")
WEAK LAPSE CONDITION (CONING)
")
INVERSION CONDITION (FANNING)
Examples of Atmospheric Stability (attribution)
मौसम की भविष्यवाणी में, पूर्वानुमान मॉडल का उपयोग वायुमंडल की भविष्य की स्थितियों की भविष्यवाणी करने के लिए किया जाता है, जो इस बात पर आधारित होता है कि प्रारंभिक अवस्था से समय के साथ जलवायु प्रणाली कैसे विकसित होती है।
जबकि पूर्वानुमान मॉडल काफी जटिल हैं (और मजबूत वैज्ञानिक और इंजीनियरिंग क्षमताओं की आवश्यकता होती है ), उन पूर्वानुमान मॉडल का विश्लेषण करने और अनुमानित मूल्यों के साथ वास्तविक अनुभवजन्य टिप्पणियों की तुलना करके उनकी सटीकता की पुष्टि करने का विज्ञान काफी सरल है।
वायु गुणवत्ता के क्षेत्र के लिए, मौसम की भविष्यवाणी की तरह, वायुमंडलीय प्रदूषण के भविष्य के सेट की भविष्यवाणी करने के लिए उपयोग किए जाने वाले मॉडल को परिभाषित करना संभव है। वास्तव में ऐसे बहुत सारे मॉडल हैं, जिन्हें अक्सर वायुमंडलीय फैलाव मॉडलिंग के रूप में जाना जाता है। और मौसम की भविष्यवाणी की तरह, सटीकता विश्लेषण की वही अवधारणा वायुमंडलीय प्रदूषण की भविष्यवाणियों पर लागू की जा सकती है।
अक्सर हमें उपयोगकर्ताओं से विश्व वायु गुणवत्ता सूचकांक परियोजना पर प्रकाशित संख्याओं के बारे में पूछताछ करने और अन्य वेबसाइटों में व्यक्त मूल्यों के साथ अंतर के बारे में पूछताछ करने के बारे में पूछताछ मिलती है। और यह वास्तव में सामान्य है, क्योंकि संख्याएं, जिन्हें वायु गुणवत्ता सूचकांक (एक्यूआई) भी कहा जाता है, शुरुआती लोगों के लिए बहुत भ्रमित करने वाली हो सकती हैं। हमें प्राप्त अंतिम संदेश निम्नलिखित है:
हम पिछले साल से तियानजिन, चीन के लिए वायु गुणवत्ता सूचकांक की जाँच कर रहे हैं, हालाँकि हमने पाया कि डेटा में आपकी वेबसाइट और एक अन्य आधिकारिक (air.tjemc.org.cn) के बीच इतना बड़ा अंतर है जो आपके वेबसाइट पर भी बताया गया है। मैं सोच रहा हूं कि कौन अधिक सटीक डेटा प्रदान कर सकता है, क्योंकि यह आउटडोर या इनडोर के निर्णय को प्रभावित करेगा। कृपया इस मुद्दे पर मेरी मदद करें। धन्यवाद!
हम पहले भी इस मुद्दे के बारे में काफी कुछ लिखते रहे हैं, उदाहरण के लिए शंघाई, सिंगापुर पीएसआई और पीएम 2.5 एक्यूआई के लिए तुलनात्मक पीएम 2.5 डेटा और हाल ही में नाउकास्ट के बारे में।
लेकिन, क्योंकि हमें अभी भी कई प्रश्न मिल रहे हैं, इसलिए अब हम दुनिया भर में उपयोग किए जाने वाले AQI पैमानों के अंतर को समझाने के लिए यह लेख लिख रहे हैं।
मार्च 2015 में, हमें बीजिंग में अमेरिकी विदेश विभाग के साथ-साथ चीन मिशन ( बीजिंग अमेरिकी दूतावास में पीएम 2.5 मॉनिटर चलाने वाली प्रसिद्ध इकाई ) के कई पर्यावरण विशेषज्ञों से मिलने का मौका मिला था।
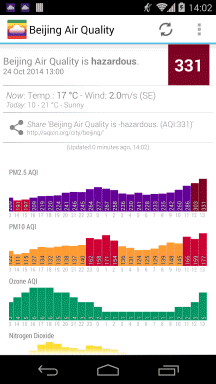
जिन सभी विषयों पर चर्चा की गई, उनमें से एक है जिसके बारे में लिखना उचित है, जिसका नाम है " नाउकास्ट " प्रणाली। इस प्रणाली का उपयोग यूएस ईपीए द्वारा µg/m3 या ppb में व्यक्त कच्चे प्रदूषक रीडिंग को AQI (0 से 500 तक स्केल) में परिवर्तित करने के लिए किया जाता है। इसका उपयोग Airnow.gov वेबसाइट पर रिपोर्ट किए गए सभी AQI मानों के लिए किया जाता है।
नाउकास्ट के पीछे की अवधारणा " 24 घंटे के औसत " की भरपाई करना है, जिसका उपयोग सांद्रता को AQI में परिवर्तित करते समय किया जाना चाहिए। इस औसत का कारण यह है कि AQI स्केल निर्दिष्ट करता है कि स्वास्थ्य संबंधी चिंता का प्रत्येक स्तर (यानी अच्छा, मध्यम,... अस्वस्थ...) 24 घंटे के एक्सपोज़र के तहत मान्य है [1] । उदाहरण के लिए, 188 AQI (अस्वास्थ्यकर) देखने पर, किसी को इसे इस प्रकार पढ़ना होगा " यदि मैं 24 घंटों के लिए बाहर रहता हूं, और उन 24 घंटों के दौरान AQI 188 है, तो स्वास्थ्य पर प्रभाव अस्वस्थ है "। यह कहने से बिल्कुल अलग है कि " यदि अब रिपोर्ट किया गया AQI 188 है, तो स्वास्थ्य पर प्रभाव अस्वास्थ्यकर है "।
हमने अभी-अभी बकरी के चंद्र नव वर्ष (2015 के लिए लकड़ी के तत्व के साथ संयुक्त) में कदम रखा है, और, विश्व वायु गुणवत्ता सूचकांक परियोजना टीम के लिए, इसका मतलब है कि दक्षिण पूर्व में नए देशों में वायु गुणवत्ता निगरानी का विस्तार करने पर पूरी गति से काम करना है। एशिया. अर्थात्: फिलीपींस , कंबोडिया और इंडोनेशिया (और अधिक, उदाहरण के लिए म्यांमार और लाओस, बहुत जल्द ही अनुसरण करेंगे)।
As there is also a huge demand for PM2.5 monitoring for Thailand (especially Chiang Mai and Bangkok), or for more station in Vietnam (Ho Chi Minh City), the extension will also cover selected countries with existing network.
लेकिन, इस बार, पिछले देशों के विपरीत, हमें हर किसी की मदद की ज़रूरत है, और विशेष रूप से आपकी मदद की ज़रूरत है यदि आप उन देशों में से एक में रह रहे हैं। इसका कारण यह है कि, इस बार, चूंकि उन देशों की पर्यावरण संरक्षण एजेंसियों (ईपीए) से वास्तविक समय की वायु गुणवत्ता की जानकारी सार्वजनिक रूप से उपलब्ध नहीं है, विश्व वायु गुणवत्ता सूचकांक परियोजना मुख्य शहरों में वायु गुणवत्ता निगरानी स्टेशनों को क्राउडसोर्स करना शुरू कर देगी। उपरोक्त देशों में से 1 .

Visible Air Pollution on the Manilla and Jakarta Skylines
हमें हाल ही में नासा रिमोट सेंसिंग निगरानी कार्यक्रम के साथ सहयोग शुरू करने का सौभाग्य मिला;
इसका उद्देश्य उन क्षेत्रों में वायु गुणवत्ता निर्धारित करने के लिए नासा उपग्रहों पर आधारित रिमोट एयर क्वालिटी सेंसिंग का उपयोग करना है जहां सेंसर उपलब्ध नहीं हैं (उदाहरण के लिए समुद्र के ऊपर, लेकिन उन देशों के लिए भी जहां सेंसर अभी तक उपलब्ध नहीं हैं)।
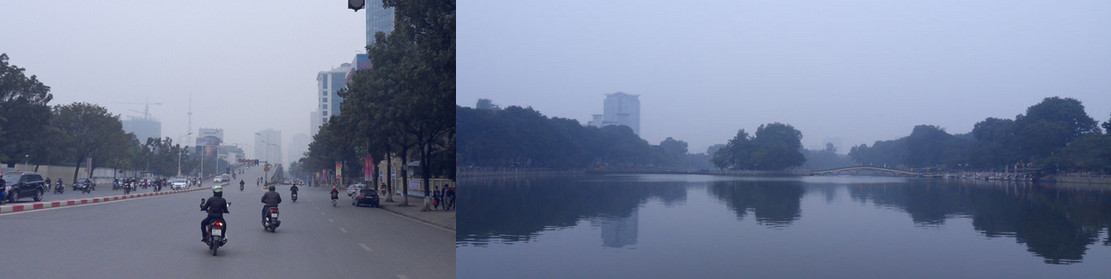
इस सप्ताह की शुरुआत में (फरवरी 2015 में), हमें हनोई के नागरिक से वायु गुणवत्ता सूचकांक के बारे में कई पूछताछ मिलीं जो हनोई पृष्ठ ( शहर/वियतनाम/हनोई ) पर प्रदर्शित किया गया था।
जांच का मुख्य कारण यह था कि विश्व वायु गुणवत्ता सूचकांक परियोजना पर प्रदर्शित वायु गुणवत्ता सूचकांक लगभग 50 (हरा AQI) स्तर था, जबकि हनोई में बाहरी दृश्यता इस तरह थी:
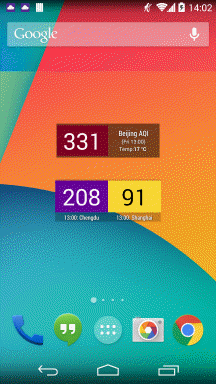
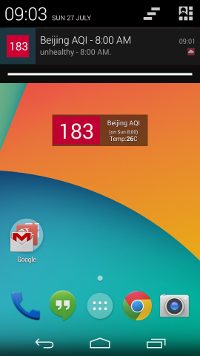
वर्ल्ड एयर क्वालिटी इंडेक्स प्रोजेक्ट एंड्रॉइड एप्लिकेशन का नवीनतम संस्करण 3.2 अभी जारी किया गया है, और कुछ नई शानदार सुविधाओं के साथ आता है:
एम्बेडेड मानचित्र जो आपको सीधे ऐप और हवा और तापमान पूर्वानुमान टैब से विश्व वायु निगरानी स्टेशन के माध्यम से नेविगेट करने देगा जो आपको आने वाले 3 दिनों का पूर्वानुमान देगा। हम उदाहरण के लिए, फ़ारेनहाइट तापमान डिस्प्ले का समर्थन करने के लिए विज़ुअल को ताज़ा करने और सेटिंग्स को अपडेट करने पर भी काम कर रहे हैं।
(Asia)
(North China)
(Beijing)
(Seoul)
Forecast
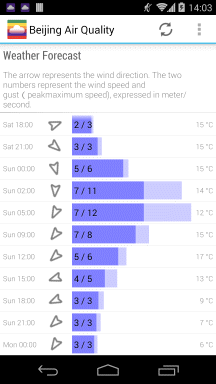
and wind conditions
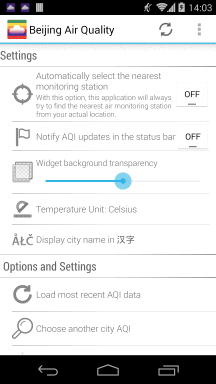
Widgets
when AQI > 150
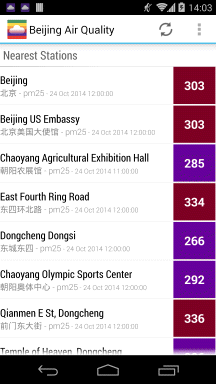
the nearest stations
Explanations
2002 से हर दूसरे वर्ष की तरह, क्लीन एयर एशिया (उर्फ क्लीन एयर इनिशिएटिव) के हमारे सहयोगी द्विवार्षिक बेहतर गुणवत्ता सम्मेलन ( baq2014est.org ) का आयोजन कर रहे हैं। इस बार, यह 19 नवंबर से 21 नवंबर 2014 तक श्रीलंका में होगा, और पर्यावरण की दृष्टि से सतत परिवहन (ईएसटी) फोरम के साथ सह-मेजबानी की जाएगी।
The "Integrated Conference of BAQ 2014 and Intergovernmental 8th Regional EST Forum in Asia" co-organized by the Ministry of Transport of Sri Lanka, The Ministry of Environment and Renewable Energy of Sri Lanka, Ministry of the Environment of Japan, United Nations Centre for Regional Development, and Clean Air Asia, in partnership with the Asian Development Bank, German International Cooperation (GIZ), and World Bank.
इस वर्ष की थीम है "स्वच्छ वायु और सतत परिवहन के लिए अगली पीढ़ी के समाधान - एशिया में रहने योग्य समाज की ओर":
यह मानते हुए कि एशिया में रहने योग्य समाज के लिए स्वच्छ हवा और टिकाऊ परिवहन आवश्यक है, हम नवोन्वेषी और स्मार्ट समाधानों (नीति, संस्थान, प्रौद्योगिकी और वित्तपोषण) का आह्वान करते हैं जो ऊर्जा, उद्योग, परिवहन और क्षेत्रीय स्रोतों से वायु प्रदूषण और ग्रीनहाउस गैसों को काफी हद तक कम करते हैं। , और एशियाई शहरों और देशों में अधिक पर्यावरणीय रूप से टिकाऊ परिवहन (ईएसटी) की ओर बदलाव में तेजी लाकर एक सुरक्षित, न्यायसंगत, पर्यावरण और लोगों के अनुकूल परिवहन प्रणाली सुनिश्चित करना।
कार्यक्रम की जाँच करें. BAQ 2014 में 800 से अधिक प्रतिभागियों के शामिल होने की उम्मीद है, और हम उनका हिस्सा बनकर किफायती वायु गुणवत्ता निगरानी समाधान पर अपना हालिया शोध प्रस्तुत करेंगे जो हम अपनी अनुसंधान प्रयोगशाला में कर रहे हैं।
लंबे इंतजार के बाद आखिरकार पर्थ और पश्चिमी ऑस्ट्रेलिया का वायु गुणवत्ता डेटा उपलब्ध हो गया है।
पश्चिमी ऑस्ट्रेलिया सरकार का पर्यावरण विनियमन विभाग (डीईआर) अब अपनी साइट: der.wa.gov.au/your-environment/air पर डेटा प्रकाशित कर रहा है।
हालाँकि DEC साइट का लिंक अभी भी काम नहीं कर रहा है, फ़ीड को इस नए पेज से एक्सेस किया जा सकता है।
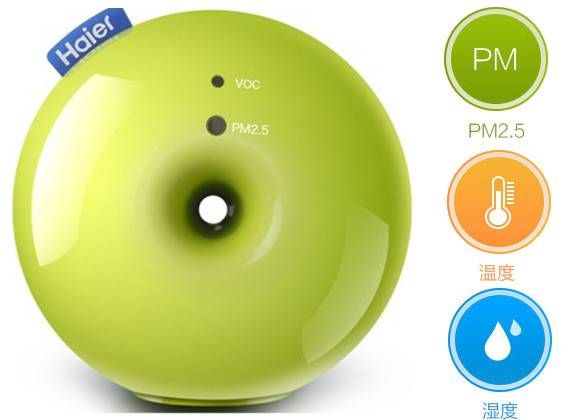
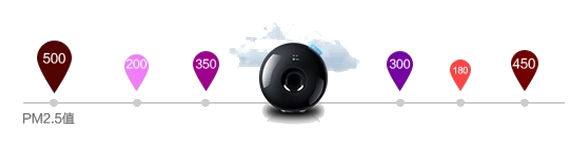
हो सकता है कि आपको हायर का हालिया उत्पाद "एयर बॉक्स" (海尔空气盒子) मिल गया हो, जो किफायती 399RMB में jd.com या taobao पर उपलब्ध है। यह बहुत ही खूबसूरती से डिज़ाइन किया गया उत्पाद है, जिसका उद्देश्य, उनकी स्मार्ट लिविंग अवधारणा के हिस्से के रूप में, स्मार्ट एयर कंडीशनर के साथ संयोजन में उपयोग करना है।
यह *दावा* करता है कि यह वाष्पशील कार्बनिक यौगिक (वीओसी, यानी ओजोन) और साथ ही प्रसिद्ध छोटे पीएम2.5 पार्टिकुलेट मैटर दोनों का पता लगाने और मापने में सक्षम है। लेकिन क्या सचमुच ऐसा हो सकता है? उत्तर जानने के लिए, प्रयोग/हायर-एयर-बॉक्स पर एयर बॉक्स के बारे में हमारे नवीनतम चल रहे प्रयोग को देखें
--
ध्यान दें: यह लेख 2013 में लिखा गया था। जबकि डायलोस मॉनिटर अभी भी एक अच्छा उत्पाद है, आजकल बहुत बेहतर और किफायती मॉनिटरिंग उत्पाद उपलब्ध हैं, इसलिए हम अब डायलोस उत्पाद खरीदने की अनुशंसा नहीं करते हैं।
उदाहरण के लिए, आप ईएस लैब्स से जीएआईए वायु गुणवत्ता निगरानी स्टेशन उत्पाद श्रृंखला की जांच कर सकते हैं।
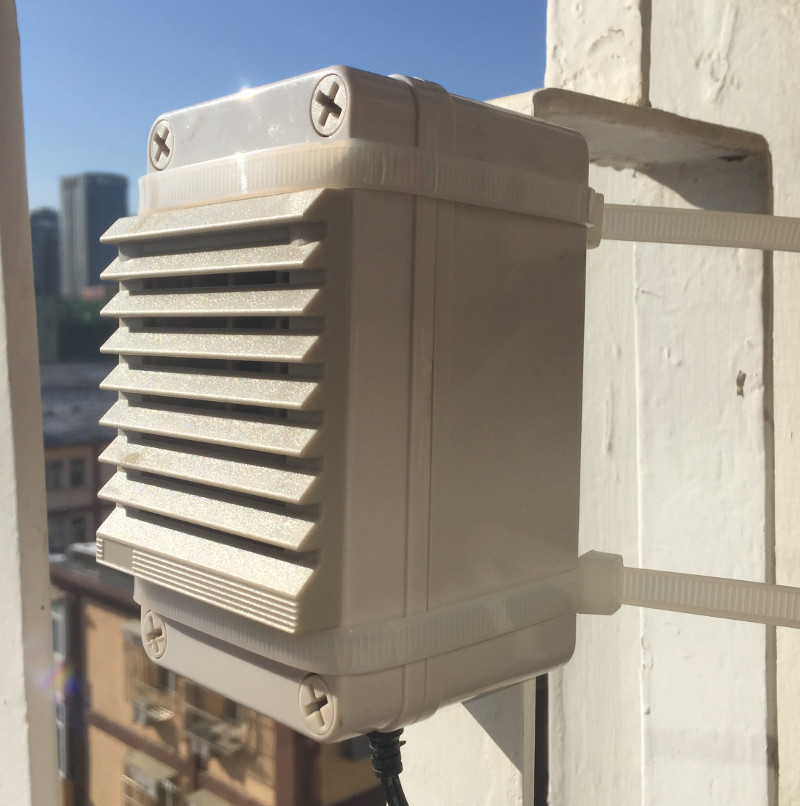
डायलोस एयर पार्टिकल काउंटर प्रयोग अभी भी चल रहा है, और पिछले 50 दिनों से चल रहा है। इसलिए, पिछले सप्ताहांत, जब बीजिंग में वायु प्रदूषण वास्तव में कम हो रहा था - तेज़ उत्तरी हवाओं के लिए धन्यवाद, हमने इस समय का उपयोग डायलोस मॉनिटर पर ही रखरखाव ब्रेक करने के अवसर के रूप में किया।
इसका कारण यह है कि, भले ही डायलोस मॉनिटर निश्चित रूप से अच्छी तरह से डिजाइन और इंजीनियर उपकरण है (हमारा मतलब यह है), यह बीजिंग के कठिन एपिसोडिक वायु प्रदूषण को झेलने के लिए शायद इतनी अच्छी तरह से कल्पना नहीं की गई है।
यह सब यह देखने के बाद शुरू हुआ कि डायलोस और बीएएम मॉनिटर के बीच सहसंबंध ग्राफ 38,000 कणों (≥0.5µ) से अधिक के स्तर के कुछ व्यवस्थित संकेत दिखाते हैं। इस प्रकार का संतृप्ति लक्षण आंतरिक वायु प्रवाह बाधा का परिणाम हो सकता है, जो "संतृप्त" वायु चैनलों के कारण हो सकता है। भारी प्रदूषण के समय में, वायु चैनल के माध्यम से बड़ी मात्रा में कणों के जाने के कारण यह घटना पूरी तरह से सामान्य है।
इसलिए, कोई आश्चर्य नहीं, डायलोस मॉनिटर खोलने के बाद, हमने पुष्टि की कि पिछले 50 दिनों के दौरान धूल के संचय से आंतरिक वायु चैनल निश्चित रूप से संतृप्त हैं:
")

-Beijing dust impact on the Dylos air particle counter internal structure-
एक बारीक ब्रश का उपयोग करके आंतरिक संरचना को साफ करने के परिणामस्वरूप, आश्चर्यजनक मात्रा में धूल निकलेगी - और यह, केवल 50 दिनों के बाहरी प्रयोग के बाद। जरा सोचिए कि आप यही सांस ले रहे हैं...

-The real Beijing dust... the one Beijiners breathe during heavy pollution day!-
दरअसल, डायलोस उपकरण पर ऐसी सफाई और रखरखाव करना कोई आश्चर्य की बात नहीं है, क्योंकि बहुत महंगे BAM उपकरण के लिए भी कुशल ऑपरेटरों द्वारा मासिक रखरखाव की आवश्यकता होती है।
--
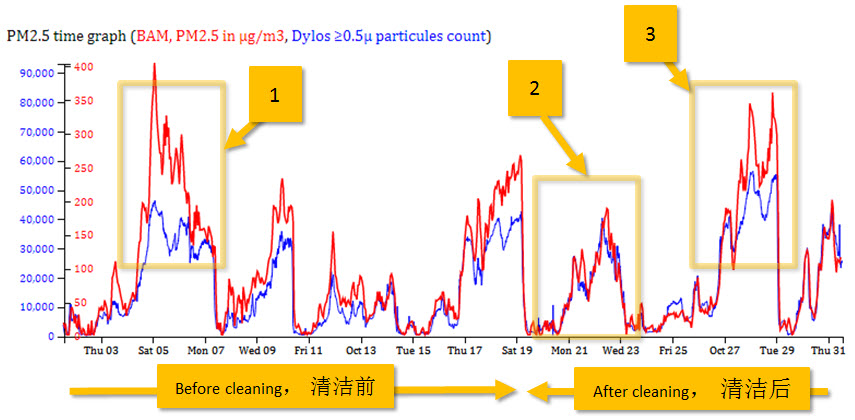
प्रारंभिक पोस्ट प्रकाशित होने के 10 दिन बाद निम्नलिखित भाग जोड़ा गया है:
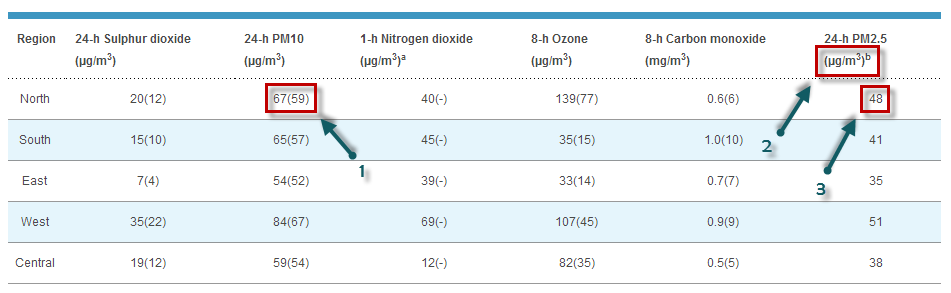
सफाई किए हुए अब 10 दिन हो गए हैं, और बीएएम और डायलोस के बीच संबंध के लिए स्थिति में निश्चित रूप से सुधार हुआ है। नीचे दिए गए ग्राफ़ से, जो सफाई से पहले और बाद में माप दिखाता है, संख्या (2) के साथ दर्शाया गया क्षेत्र बीएएम और डायलोस के बीच एक बहुत अच्छी समानता (सहसंबंध) दिखाता है। लेकिन, भारी प्रदूषण की स्थिति में, अभी भी लेवलिंग (माप में विचलन) के लगातार संकेत हैं, जैसा कि ज़ोन संख्या (1) और (3) से उजागर किया गया है। हालाँकि, सफाई (ज़ोन (3) ) के बाद विचलन पहले (ज़ोन (1) ) की तुलना में कम खराब लगता है। हम इस लेवलिंग घटना पर परामर्श करने के लिए डायलोस कंपनी से संपर्क कर रहे हैं, और इस पोस्ट को बाद में अपडेट करेंगे।
(Click on the picture to open the real time version)
--
कुछ ऐतिहासिक कारणों से, विश्व वायु गुणवत्ता सूचकांक परियोजना के कुछ शहरों के लिए उपयोग किए जाने वाले AQI रूपांतरण सूत्र अद्यतन 2012 EPA PM 2.5 मानक का उपयोग नहीं कर रहे थे। (यह केवल जापान और ताइवान जैसे एशिया के शहरों के लिए प्रासंगिक है। अन्य महाद्वीप (अमेरिका, यूरोप और ऑस्ट्रेलिया) हमेशा 2012 मानक का उपयोग कर रहे हैं।
14 दिसंबर 2012 को प्रकाशित इस अद्यतन ईपीए मानक में मुख्य परिवर्तन पिछले (1999 में प्रकाशित) की तुलना में, पीएम 2.5 AQI स्तर 50 को 15µg/m 3 से 12µg/m 3 तक कम (सीमा) करना है, और ऐसा अधिक सख्त वायु गुणवत्ता मानकों को लागू करने के लिए किया गया है।
9 सितंबर 2013 से, सभी देश अब समान PM2.5 AQI रूपांतरण पैमाने का उपयोग कर रहे हैं, जो इस तालिका में दर्शाया गया है:
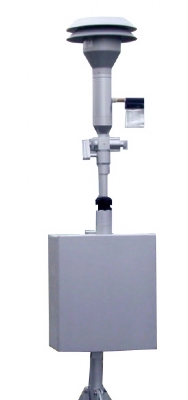
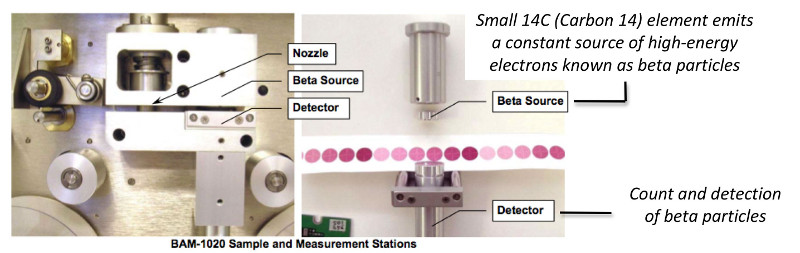
हवा की गुणवत्ता को मापने का सबसे आम तरीका, जहां तक पीएम 10 और पीएम 2.5 कणों की बात है, तथाकथित बीटा एटेन्यूएशन मॉनिटर्स , उर्फ बीएएम (दाईं ओर चित्र देखें) का उपयोग करना है। वे पेशेवर उपकरण हैं, और चीन, अमेरिका और दुनिया के अधिकांश हिस्सों में वायु गुणवत्ता निगरानी के लिए उपयोग किए जाने वाले एकमात्र आधिकारिक उपकरण भी हैं। सबसे प्रसिद्ध निर्माता अमेरिका स्थित मेट-वन नामक कंपनी है।
बीएएम कार्य सिद्धांत काफी सरल है: यह पार्टिकुलेट मैटर (पीएम) की एक पतली परत के माध्यम से प्रसारित बीटा कणों (इलेक्ट्रॉनों) की संख्या में कमी को मापता है। जैसे-जैसे पीएम परत की मोटाई बढ़ती है, बीटा कणों की संख्या उतनी ही कम हो सकती है।
इस प्रकार के BAM उपकरण के साथ एकमात्र समस्या यह है कि इसकी अनुमानित लागत 120K CNY (15K EUR) है। केवल चीन में, उनमें से लगभग 500 (प्रत्येक शहर के लिए लगभग 10 स्टेशन) हैं, और फिर भी, यह पर्याप्त नहीं है क्योंकि अभी भी कई शहर ऐसे हैं जहां कोई पीएम 2.5 रीडिंग नहीं है। थाईलैंड में, 21 स्वचालित (यानी प्रति घंटा रीडिंग वाले) स्टेशन हैं, लेकिन उनमें से कोई भी पीएम 2.5 डेटा प्रदान नहीं करता है। और वियतनाम में, पूरे देश के लिए केवल 3 स्टेशन हैं।
With the recent Southeast Asia Smog from Indonesia affecting Singapore and now Malaysia, we got many questions about why there is a difference between the data which can be read from Singapore NEA website (nea.gov.sg) and the World Air Quality Index project Singapore webpage.
उदाहरण के लिए, एनईए वेबसाइट पर आज क्या पढ़ा जा सकता है:
ऐतिहासिक कारण से, विश्व वायु गुणवत्ता सूचकांक परियोजना वायु गुणवत्ता स्तरों के लिए चीन एमईपी (पर्यावरण संरक्षण मंत्रालय) पदनाम का उपयोग कर रही है। यह अब पुराना इतिहास है, और पदनाम, अब से, यूएस ईपीए (पर्यावरण संरक्षण एजेंसी) एयरनाउ मानकों का पालन करेगा।
नीचे दी गई तालिका दो मानकों के बीच पदनाम में अंतर, साथ ही विभिन्न भाषाओं के अनुवादों का सारांश प्रस्तुत करती है।
पीएम 10 बनाम पीएम 2.5 पर अक्सर पूछे जाने वाले प्रश्न प्रविष्टि के बारे में आज चर्चा करते हुए, जिसे मैंने कल पोस्ट किया था, मेरे मित्र क्लॉस ने सुरक्षा मास्क की उपयोगिता पर चुनौती दी। वह वास्तव में सोच रहा था कि क्या आजकल के आधुनिक मास्क वास्तव में सभी छोटे हानिकारक पीएम 2.5 कणों को कुशलतापूर्वक फ़िल्टर कर सकते हैं?
दरअसल, यह एक बहुत अच्छा सवाल है! यदि आपको बीजिंग में मास्क पहनना है, तो यह सुनिश्चित करना बेहतर होगा कि यह वास्तव में खराब कणों को फ़िल्टर करता है।
Since I did not have the answer to his question, I just dropped an email to Francis Chu from the Singapore totobobo® mask manufacturing company, who replied in almost no time:
हमें इस सप्ताह सेवेरिन पी. से एक बहुत अच्छा और प्रासंगिक प्रश्न मिला, जिन्होंने पीएम2.5 सांद्रता बनाम पीएम10 सांद्रता के बारे में पूछा। सेवेरिन ने अपने मेल में जो पूछा वह था:
मुझे समझ में नहीं आता कि पीएम2.5 की सांद्रता अक्सर पीएम10 की सांद्रता से अधिक क्यों होती है।
क्या 2.5 माइक्रो से छोटे पीएम को 10 माइक्रो से छोटे पीएम में शामिल नहीं किया जाता है?
अपने जवाब के लिए धन्यवाद
सेवेरिन का प्रश्न पूरी तरह से सही है: परिभाषा के अनुसार, PM2.5, 2.5 माइक्रोमीटर से छोटे कण हैं, इसलिए वास्तव में, उन्हें 10 माइक्रोमीटर से छोटे के रूप में भी शामिल किया जाना चाहिए।
and lúwān shī zhuān fùxiǎo (上海师范专科学校附属小学).
The first station is maintained by US Consulate in Shanghai, while the two last ones are provided by Shanghai Environment Monitoring Center(上海市环境监测中心), which is governmental center.
If you have concerns about some stations reporting lower PM2.5 data compared to others, then refer to the following graphics; they show the relative PM2.5 reporting for the last 5 days for each of the above mentioned stations:
वायु गुणवत्ता और प्रदूषण मापन के बारे में:
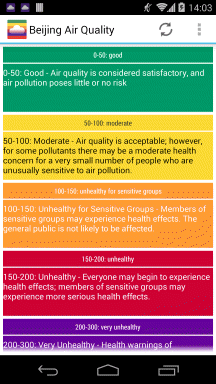
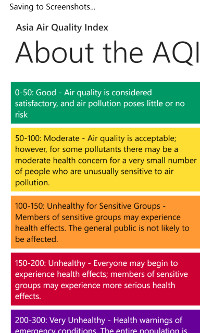
| - | वायु गुणवत्ता सूचकांक (एक्यूआई) मान | स्वास्थ्य संबंधी चिंता का स्तर |
| 0 - 50 | अच्छा | वायु गुणवत्ता को संतोषजनक माना जाता है, और वायु प्रदूषण कम या कोई जोखिम नहीं बनता है |
| 51 -100 | मध्यम | वायु गुणवत्ता स्वीकार्य है; हालांकि, कुछ प्रदूषकों के लिए बहुत कम संख्या में लोगों के लिए एक मामूली स्वास्थ्य चिंता हो सकती है जो वायु प्रदूषण के लिए असामान्य रूप से संवेदनशील हैं। |
| 101-150 | अस्वास्थ्यकर संवेदनशील समूहों के लिए | संवेदनशील समूहों के सदस्यों को स्वास्थ्य प्रभाव का अनुभव हो सकता है। आम जनता को प्रभावित होने की संभावना नहीं है। |
| 151-200 | अस्वस्थ | हर किसी को स्वास्थ्य प्रभाव का अनुभव करना शुरू हो सकता है; संवेदनशील समूहों के सदस्यों को अधिक गंभीर स्वास्थ्य प्रभाव का अनुभव हो सकता है |
| 201-300 | बहुत अस्वस्थ | आपातकालीन स्थितियों की स्वास्थ्य चेतावनियां। पूरी आबादी प्रभावित होने की अधिक संभावना है। |
| 300+ | खतरनाक | स्वास्थ्य चेतावनी: हर किसी को अधिक गंभीर स्वास्थ्य प्रभाव का अनुभव हो सकता है |
वायु गुणवत्ता और प्रदूषण के बारे में अधिक जानने के लिए, विकिपीडिया वायु गुणवत्ता विषय या वायु गुणवत्ता और आपके स्वास्थ्य के लिए एयरनाउ गाइड देखें।
बीजिंग डॉक्टर रिचर्ड सेंट साइर एमडी की बहुत उपयोगी स्वास्थ्य सलाह के लिए, www.myhealthbeijing.com ब्लॉग देखें।

This page has been generated on Tuesday, Apr 7th 2026, 08:03 am CST from jp2n
Settings
Celsius |