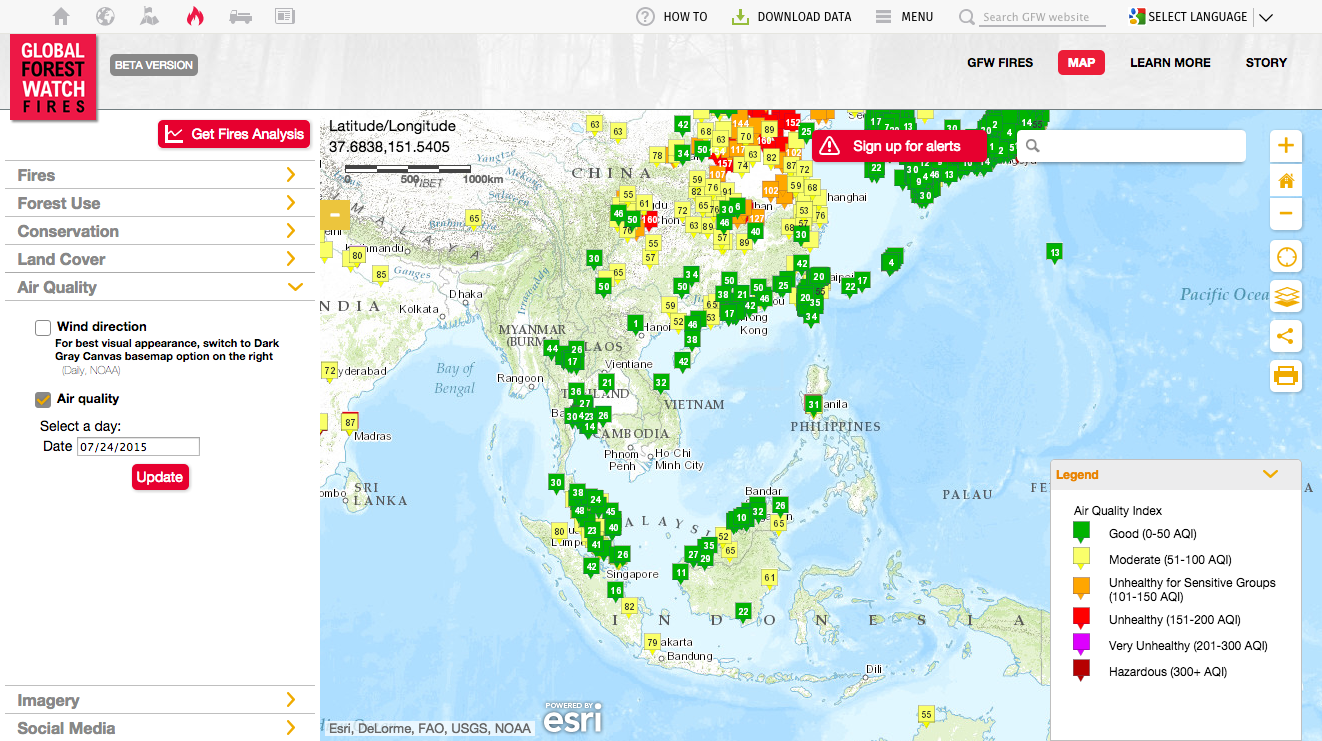
We have been recently cooperating with quite a few more EPAs (environmental protection agencies) world-wide. Among all the requests which we have had, it is actually to provide a Web Map Service so that the EPA themselves can include the real-time Air Quality data onto the map from their website.
One of the obvious advantages of using such a map web service from us is to benefit from the trans-boundary data which we are curating, i.e. a world-wide Air Quality information is provided without country boundary limits.
The second advantage is not only that this is a free service, but it is also completely compatible with standard map technologies from google, bing or leaflet, which allows a quick and easy integration with any existing website.
--
Tile Map Service Endpoint
The tile map server is available from the url `https://tiles.aqicn.org/tiles/{aqi}/{z}/{x}/{y}.png`, where aqi refers for the type of marker to be plotted, which can be:
usepa-aqi: Plots markers based on the composite AQI calculated with the US EPA standard.usepa-pm25: PM2.5 based AQI - if a station does not have PM2.5 reading, then it is not plotted.usepa-10: Same as above, but for PM10.usepa-o3: Same as above, but for Ozone (based on the 1 hour breakpoints).usepa-no2: Same as above, but for Nitrogen Dioxide.usepa-so2: Same as above, but for Sulfur Dioxide.usepa-co: Same as above, but for Carbon Monoxide.asean-pm10: Asean PM10 raw PM10 concentration (explanations).
Below is the example for the 6 individual pollutants for South China.
Web-Service usage conditions
The map webservice is provided for free, under the condition of reasonable usage limits and acceptable usage policy. The tiles are currently refreshed every 15 minutes (and up to 1 hour in case of high traffic).
Note that our server capacity is limited, so we reserve the right to pause the service at any time, for instance to performance server maintenance. If you need a more stable integration, contact us to find a proper solution, such as setting-up a dedictated server.
Last you also need to specify your own token ID as an extra argument to the tile service endpoint, like `token=_TOKEN_ID_` in the following url: `https://tiles.aqicn.org/tiles/{aqi}/{z}/{x}/{y}.png?token=_TOKEN_ID_`.
You can request your own token ID from this page. You just need to provide a valid email, and you can get your own token within a minute.
Web-Service usage restrictions

When using the service, please do not forget to provide the attribution to the World Air Quality Index project as well as the EPA providing the data (if you use the map service to show data from a specicic location or source). You can get the full list of all the EPA from this link.
As a matter of fact, do not act like the World Resource Institute (WRI): they were scrapping our entire data feed, and republishing the data on their own project website without giving any single attribution for our work... That's not quite ok when you know that they get funded up to 80 millions USD each year. Don't believe us? Check this snapshot.
Future extensions
We are already working on extending this web-service to provide more configurations. For instance:
- To support for more standards other than the US EPA, such as `eucaqi-xxx` for the European Common Air Quality Index, `innaqi-xxx` for the Indian National Air Quality Index , `raw-xxx` for the unconverted raw data, etc.
- More indicators such as the
wind(both for the current wind speed and wind direction), as well as forecastedventilationindex [1] which can be extrememly usefull for forecasting. - Support for
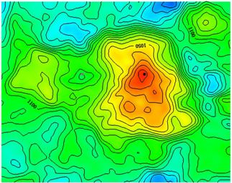
kriginggeo-statistical surface estimation - i.e. heatmap like interpolations (picture on the right) which can be usefull for lower density monitoring network. - Support for
24 hoursand8 hoursdata averaging . Our map are currenly based on 1 hour averaging, but longer averaging period are useful for epidemilogicial studies. - Support for
GeoJSONbased tile rendering, allowing the customization of markers and color scale, as well as a better integration with tools like tuftjs.org.
Note that to support more AQI standards and tile configurations, we need to increase our server capacity (both processing power and Storage), for which we will require sponsorship. If you are working for one of the large cloud company, or for instance Google or Microsoft and reading this message, then why not considering making your company environmentally-friendly (combatting air pollution by promoting citizen awarness), and sponsoring part of the needed server extra capacity? That would not only help us, but also help the whole community of researchers, scientists, statisticians and epidemiologists working with environmental data and sciences.
--

Sample code: Integration with Leaflet
Leaflet is an extremely cool light-weight open-source JavaScript library for mobile-friendly interactive maps, created by Vladimir Agafonkin of MapBox.
<div id='map' style='height:380px;' />
<link rel="stylesheet" href="http://cdn.leafletjs.com/leaflet-0.7.5/leaflet.css" />
<script src="http://cdn.leafletjs.com/leaflet-0.7.5/leaflet.js"></script>
<script>
var OSM_URL = 'http://{s}.tile.openstreetmap.org/{z}/{x}/{y}.png';
var OSM_ATTRIB = '© <a href="http://openstreetmap.org/copyright">OpenStreetMap</a> contributors';
var osmLayer = L.tileLayer(OSM_URL, { attribution: OSM_ATTRIB });
var WAQI_URL = "https://tiles.waqi.info/tiles/usepa-aqi/{z}/{x}/{y}.png?token=_TOKEN_ID_";
var WAQI_ATTR = 'Air Quality Tiles © <a href="http://waqi.info">waqi.info</a>';
var waqiLayer = L.tileLayer(WAQI_URL, { attribution: WAQI_ATTR });
var map = L.map('map').setView([51.505, -0.09], 11);
map.addLayer(osmLayer).addLayer(waqiLayer);
</script>
Sample code: Integration with Google
Google maps are quite convinient and free up to 25,000 API calls a day. Note that google maps is available in china, but the maps API script needs to be loaded from google.cn (`http://maps.google.cn/maps/api/js`) instead of the regular https://maps.googleapis.com/maps/api/js url.
<div  id='map'  style='height:380px;'  />
<script  src="https://maps.googleapis.com/maps/api/js"></script>

<script>
      var  map  =  new  google.maps.Map(document.getElementById('map'),  {
            center:  new  google.maps.LatLng(51.505,  -0.09),
            mapTypeId:  google.maps.MapTypeId.ROADMAP,
            zoom:  11
      });

      var  t  =  new  Date().getTime();
      var  waqiMapOverlay  =  new  google.maps.ImageMapType({
            getTileUrl:  function  (coord,  zoom)  {
                  return  'https://tiles.aqicn.org/tiles/usepa-aqi/'  +  zoom  +  "/"  +  coord.x  +  "/"  +  coord.y  +  ".png?token=_TOKEN_ID_";
            },
            name:  "Air  Quality",
      });

      map.overlayMapTypes.insertAt(0,  waqiMapOverlay);
</script>
Sample code: Integration with Microsoft Bing Maps
Bing maps are actually quite cool, and also using Here base map for some countries. There are still quite a lot of web site based on Microsoft Maps (and especially in the domain of Air Quality and weather).
<div  id='map'  style='height:380px;'    style='position:relative;'/>
<script  type='text/javascript'  src='https://www.bing.com/api/maps/mapcontrol?callback=initBingMap'  async  defer></script>

<script>
      function  initBingMap()  {

            var  map  =  new  Microsoft.Maps.Map(document.getElementById('map'),  {
                  center:  new  Microsoft.Maps.Location(51.505,  -0.09),
                  zoom:  11,
            });

            var  options  =  {
                  uriConstructor:  "https://tiles.aqicn.org/tiles/usepa-aqi//{zoom}/{x}/{y}.png?token=_TOKEN_ID_",
                  minZoom:  1,
                  maxZoom:  15
            };
            var  waqiTileSource  =  new  Microsoft.Maps.TileSource(options);
            var  waqiTilelayer  =  new  Microsoft.Maps.TileLayer({  mercator:  waqiTileSource  });
            map.layers.insert(waqiTilelayer);
      }
</script>