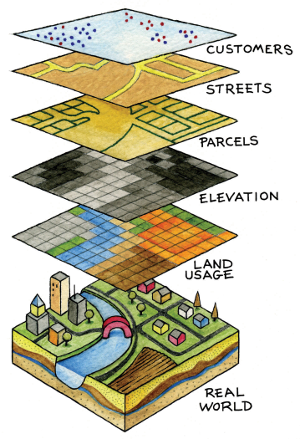
Напоследък си сътрудничим с още доста EPA (агенции за опазване на околната среда) по целия свят. Сред всички искания, които получихме, всъщност е да предоставим услуга за уеб карти, така че самите EPA да могат да включват данните за качеството на въздуха в реално време на картата от своя уебсайт.
Едно от очевидните предимства на използването на такава уеб услуга за картографиране от нас е да се възползвате от трансграничните данни, които ние поддържаме, т.е. информация за качеството на въздуха в световен мащаб се предоставя без ограничения на националните граници.
Второто предимство е не само, че това е безплатна услуга, но и е напълно съвместима със стандартните картографски технологии от google, bing или leaflet, което позволява бърза и лесна интеграция с всеки съществуващ уебсайт.
--
Крайна точка на услугата за карти на плочки
Сървърът за карта на плочки е достъпен от url `https://tiles.aqicn.org/tiles/{aqi}/{z}/{x}/{y}.png`, където aqi се отнася за типа маркер към да се начертае, което може да бъде:
usepa-aqi: Plots markers based on the composite AQI calculated with the US EPA standard.usepa-pm25: PM2.5 based AQI - if a station does not have PM2.5 reading, then it is not plotted.usepa-10: Same as above, but for PM10.usepa-o3: Same as above, but for Ozone (based on the 1 hour breakpoints).usepa-no2: Same as above, but for Nitrogen Dioxide.usepa-so2: Same as above, but for Sulfur Dioxide.usepa-co: Same as above, but for Carbon Monoxide.asean-pm10: Asean PM10 raw PM10 concentration (explanations).
По-долу е даден пример за 6-те отделни замърсители за Южен Китай.
Условия за използване на уеб услугата
Уеб услугата за карти се предоставя безплатно, при условие за разумни ограничения за използване и приемлива политика за използване. В момента плочките се обновяват на всеки 15 минути (и до 1 час в случай на голям трафик).
Обърнете внимание, че капацитетът на нашия сървър е ограничен, така че си запазваме правото да поставим на пауза услугата по всяко време, например за поддръжка на сървъра за ефективност. Ако имате нужда от по-стабилна интеграция, свържете се с нас, за да намерим подходящо решение, като например настройка на специален сървър.
Накрая също трябва да посочите своя собствен идентификатор на токен като допълнителен аргумент към крайната точка на услугата за плочки, като `token=_TOKEN_ID_` в следния url: `https://tiles.aqicn.org/tiles/{aqi}/{z }/{x}/{y}.png? токен=_TOKEN_ID_ `.
Можете да поискате свой собствен идентификатор на токен от тази страница . Просто трябва да предоставите валиден имейл и можете да получите свой собствен токен в рамките на минута.
Ограничения за използване на уеб услуга

Когато използвате услугата, моля, не забравяйте да предоставите приписването на проекта за World Air Quality Index, както и EPA, предоставящи данните (ако използвате услугата за карти, за да показвате данни от конкретно местоположение или източник). Можете да получите пълния списък на всички EPA от тази връзка .
В интерес на истината, не действайте като Световния институт за ресурси (WRI): те бракуваха цялата ни емисия с данни и публикуваха отново данните на собствения си уебсайт на проекта, без да дават нито едно признание за нашата работа... Това не е съвсем наред когато знаете, че те получават финансиране до 80 милиона щатски долара всяка година. Не ни вярвате? Вижте тази моментна снимка .
Бъдещи разширения
Вече работим върху разширяването на тази уеб услуга, за да предоставим повече конфигурации. Например:
- За поддържане на повече стандарти, различни от US EPA, като `eucaqi- xxx` за европейския общ индекс за качество на въздуха , `innaqi- xxx` за индийския национален индекс за качество на въздуха , `raw- xxx` за непреобразуваните необработени данни, и т.н.
- Повече индикатори като
wind(както за текущата скорост и посока на вятъра), така и прогнозиран индексventilation[1] , който може да бъде изключително полезен за прогнозиране. - Поддръжка за геостатистическа повърхностна оценка
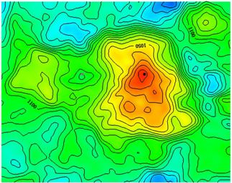
kriging- т.е. интерполации като топлинна карта (снимка вдясно), които могат да бъдат полезни за мрежи за мониторинг с по-ниска плътност. - Поддръжка за осредняване на данни за
24 hoursи8 hours. Нашата карта в момента се основава на осредняване за 1 час, но по-дългият период на осредняване е полезен за епидемиологични проучвания. - Поддръжка за изобразяване на плочки, базирано на
GeoJSON, позволяващо персонализиране на маркери и цветова скала, както и по-добра интеграция с инструменти като tuftjs.org .
Обърнете внимание, че за да поддържаме повече AQI стандарти и конфигурации на плочки, трябва да увеличим капацитета на нашия сървър (както процесорна мощност, така и съхранение), за което ще се нуждаем от спонсорство. Ако работите за една от големите облачни компании, или например Google или Microsoft и четете това съобщение, тогава защо не обмислите да направите вашата компания екологична ( борба със замърсяването на въздуха чрез насърчаване на информираността на гражданите ) и да спонсорирате част от необходимия сървър допълнителен капацитет? Това би помогнало не само на нас, но и на цялата общност от изследователи, учени, статистици и епидемиолози, работещи с данни и науки за околната среда.
--

Примерен код: Интеграция с брошура
Leaflet е изключително страхотна лека JavaScript библиотека с отворен код за удобни за мобилни устройства интерактивни карти, създадена от Владимир Агафонкин от MapBox.
<div id='map' style='height:380px;' />
<link rel="stylesheet" href="http://cdn.leafletjs.com/leaflet-0.7.5/leaflet.css" />
<script src="http://cdn.leafletjs.com/leaflet-0.7.5/leaflet.js"></script>
<script>
var OSM_URL = 'http://{s}.tile.openstreetmap.org/{z}/{x}/{y}.png';
var OSM_ATTRIB = '© <a href="http://openstreetmap.org/copyright">OpenStreetMap</a> contributors';
var osmLayer = L.tileLayer(OSM_URL, { attribution: OSM_ATTRIB });
var WAQI_URL = "https://tiles.waqi.info/tiles/usepa-aqi/{z}/{x}/{y}.png?token=_TOKEN_ID_";
var WAQI_ATTR = 'Air Quality Tiles © <a href="http://waqi.info">waqi.info</a>';
var waqiLayer = L.tileLayer(WAQI_URL, { attribution: WAQI_ATTR });
var map = L.map('map').setView([51.505, -0.09], 11);
map.addLayer(osmLayer).addLayer(waqiLayer);
</script>
Примерен код: Интеграция с Google
Картите на Google са доста удобни и освобождават до 25 000 API извиквания на ден. Обърнете внимание, че google maps се предлага в Китай, но API скриптът за карти трябва да се зареди от google.cn (`http://maps.google.cn/maps/api/js`) вместо от обичайния https://maps .googleapis.com/maps/api/js url.
<div  id='map'  style='height:380px;'  />
<script  src="https://maps.googleapis.com/maps/api/js"></script>

<script>
      var  map  =  new  google.maps.Map(document.getElementById('map'),  {
            center:  new  google.maps.LatLng(51.505,  -0.09),
            mapTypeId:  google.maps.MapTypeId.ROADMAP,
            zoom:  11
      });

      var  t  =  new  Date().getTime();
      var  waqiMapOverlay  =  new  google.maps.ImageMapType({
            getTileUrl:  function  (coord,  zoom)  {
                  return  'https://tiles.aqicn.org/tiles/usepa-aqi/'  +  zoom  +  "/"  +  coord.x  +  "/"  +  coord.y  +  ".png?token=_TOKEN_ID_";
            },
            name:  "Air  Quality",
      });

      map.overlayMapTypes.insertAt(0,  waqiMapOverlay);
</script>
Примерен код: Интеграция с Microsoft Bing Maps
Картите на Bing всъщност са доста готини, а също така използват базова карта Here за някои държави. Все още има доста уеб сайтове, базирани на Microsoft Maps (и особено в областта на качеството на въздуха и времето).
<div  id='map'  style='height:380px;'    style='position:relative;'/>
<script  type='text/javascript'  src='https://www.bing.com/api/maps/mapcontrol?callback=initBingMap'  async  defer></script>

<script>
      function  initBingMap()  {

            var  map  =  new  Microsoft.Maps.Map(document.getElementById('map'),  {
                  center:  new  Microsoft.Maps.Location(51.505,  -0.09),
                  zoom:  11,
            });

            var  options  =  {
                  uriConstructor:  "https://tiles.aqicn.org/tiles/usepa-aqi//{zoom}/{x}/{y}.png?token=_TOKEN_ID_",
                  minZoom:  1,
                  maxZoom:  15
            };
            var  waqiTileSource  =  new  Microsoft.Maps.TileSource(options);
            var  waqiTilelayer  =  new  Microsoft.Maps.TileLayer({  mercator:  waqiTileSource  });
            map.layers.insert(waqiTilelayer);
      }
</script>


