The ambient Ozone, refered as O3 and also called called ground-level or tropospheric Ozone impacts everyone on earth regardless of the country, as shown on the image on the right [1].
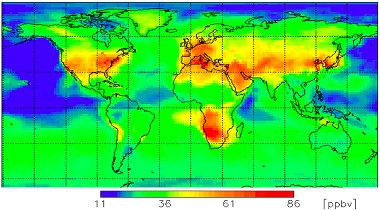
(Attribution: WMO GAW research on reactive gases )
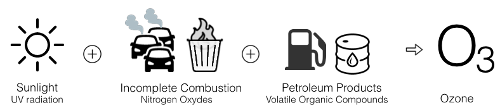
Unlike particulate matter (PM2.5), the ground-level Ozone is not emitted directly. It is instead produced through a series of chemical reactions that occur in presence of nitrogen oxides, volatile organic compounds, sunlight and high temperatures, as shown on the following visual:
Quantifying the impact of this ground level Ozone on Health is done via the Air Quality Index standard which each country defines. What is interesting is that half of the world is using a standard based on milligrams measurement, while the rest is using ppb based measurement. But is this really a problem? This is what we will be looking at in this article.
--
The US EPA standard for Ozone is based on ppm, while the European one are based on milligrams.
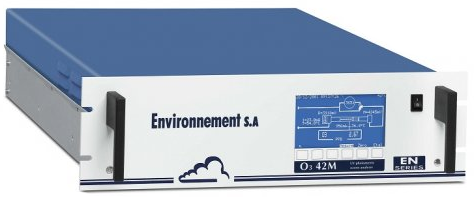
So, we naturally targetted our question to Environnement S.A, one of the leading European enviromental equipment manufacturer, who develops its own O342M Ozone analyser (see picture on the right).
The O342M is both both certified by the US EPA and the EU (see specsheet), therefore able to provide measurement in both ppm and milligrams. Our question to Environnement S.A was 'How does your ozone analyser support both ppm and milligrams output? Is there any hardware difference for measurement? If not, is there any standard for the convertion?'.
Ozone Measurement Principles
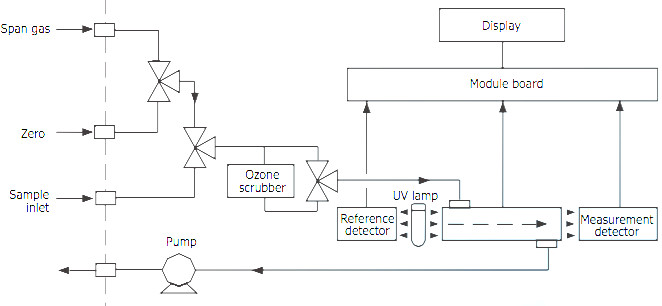
The ozone measurement is based on the universally known UV absorption principle [2], which consists in measuring UV absorption of ozone molecules. Ozone concentration is determined by difference between UV absorption of the gas sample and the sample without ozone after filtration performed by a catalytic converter.
In this system, the Ozone concentration is measured as an amount of light energy per volume of air, from which the concentration in ppbv is deducted. The lower detectable limit for this system is 0.4 ppb (corresponding to an AQI of 0.3, based on the US EPA 8-hour Ozone standard). This system does not measure the mass as such, but there is a standard way of doing the convertion from ppmv to mg/m3.
Converting Atmospheric Pollutant Concentrations: from ppmv to mg/m3
First, ppm (parts per million [3] ) and ppb (parts per billion) are defined as `1 ppm = 1/106 = 10-6` and `1 ppb = 1/109 = 10-9`. So `1 ppm = 1000 ppb or 1 ppb = 10-3 ppm`.
The conversion factor depends on the temperature at which you want the conversion (usually 25 degrees Centigrade in the US), as well as the ambient pressure. At an ambient pressure of 1 atmosphere, the general equation is:
-
c= concentration in mg/m3(i.e., milligrams of gaseous pollutant per cubic meter of ambient air) -
MW= molecular weight of the gaseous pollutant -
ppmv= parts per million by volume (i.e., volume of gaseous pollutant per million volumes of ambient air) -
t= ambient temperature in degrees centigrade. -
12.187= inverse of the Universal Gas Law constant[4]
As an example, for gaseous pollutant O3 (ozone), to convert 20 ppmv of Ozone to `mg/m3 at 25 °C` and 1 atmosphere, the following formula is used:
48.00 = `MW(O3)` = molecular weight of Ozone O3. European and US Convertion Standards
The assumption on the ambient temperature and atmospheric pressure is actually standardized and summurized in the following table for US, Europe or normal conditions. For our O342M Ozone analyzers, this coefficient is user programmable by the operator of the instrument.
| Gas | Standard Conditions for Temperature and Pressure ( STP) | ||
| "STP US" Conditions at 25°C (US EPA standard) [5] 1013 mbar and 298K | "STP European Union" Conditions at 20°C (EU standard) [6] 1013 mbar and 293K | "Normal" Conditions at 0°C 1013 mbar and 273K | |
| O3 - Ozone | 1 ppb = `1,97` µg/m3 | 1 ppb = `2,00` µg/m3 | 1 ppb = `2,15` µg/m3 |
| NO2 - Nitrogen Dioxyde | 1 ppb = `1,88` µg/m3 | 1 ppb = `1,91` µg/m3 | 1 ppb = `2,05` µg/m3 |
Note: For those interested in knowing why 20°C is used as the standard reference temperature, you can check Ted Doiron's article on "20 °C—A short history of the standard reference temperature for industrial dimensional measurements".
Many thanks to Serge from Environnement S.A for the quick and precise answer on the Ozone monitors. Note that the same concept also applies to other gases such as Nitrogen Dioxide (for instance using the AS32M analyser).
--
To push the investigation a bit further, the next question is what would be the impact on the calculated Air Quality Index if the actual temperature and pressure would be used instead of the reference one?
Impact from ambient temperature
The last question is to look at the impact of a temperature variation on the Air Quality Index.
For instance, let assume that an instrument is measuring an average of `120 mg/m3` of Ozone over 1 hour, which corresponds to an AQI of 50 (Medium) according to the European Common Air Quality Index (CAQI).
At 20°C and 1 atm, `120 mg/m^3` converts to 120/2.00, i.e. 60.0 ppmv. So let us assume that this is the actual measurement from the Ozone sensor. The question is then, what if the ambient temperature was peaking to 42°C, as it sometimes happen during summer heat waves, then what would be the correct mass? The convertion formula is:
$$c = { ppmv \times 12.187 \times MW \over 273.15 + t } = 111.37 $$
This results in a difference of `8.6 mg/m^3` of measured Ozone. When applying the CAQI standard, the corresponding AQI is 46.4 (instead of 50 using the standard 20°C condition). This is actually an acceptable difference.
The generalized adjustement formula depending on the ambient temperature is summurized with the graph on the right. The x-axis is the ambient temperature, and the y-axis the calculated AQI is the actual temperature would be used instead of the reference one (20°C).
Impact from atmospheric pressure
As concerns the atmospheric pressure, the varation is defined by the Ideal Gas Law (`PV = nRT`).
The value 12.187 is actually the inverse of the Universal Gas Law constant R. So, to understand the impact of atmospheric pressure, the following formula can be used:
In other words, one just need to divide the convertion factor by the current atmosphere. Assuming that the pressure p is expressed in millibars (1 atm = 1013.25 mb), the generalized convertion formula becomes:
-
c= concentration in mg/m3(i.e., milligrams of gaseous pollutant per cubic meter of ambient air) -
MW= molecular weight of the gaseous pollutant -
ppmv= parts per million by volume (i.e., volume of gaseous pollutant per million volumes of ambient air) -
t= ambient temperature in degrees centigrade. -
p= ambient atmospheric pressure in millibars.
Conclusions
The above explanations confirm our initial hypothesis that even though Ozone readings can be provided with different units (ppm and `mg/m^3`), this is actually not a problem since there is a standard way to convert readings from `mg/m^3 to ppm` and vice-versa. Moreover, the impact of using the reference STP (Standard Temperature & Pressure) instead of the actual ambient temperature and pressure is minimal, i.e. just units of Index in difference for the Ozone.
Credits: Ozone visual recreated using Icon pack by Icons8 and taken from American Chemical Society.
