The Dylos Air Quality Sensor experiment

Paylaşmak: aqicn.org/sensor/beijing/sanlitun/tr/
Introduction

For more information about those real-time dylos and BAM monitor PM2.5 and PM10 readings, please refer to our article on the Dylos Air Particule Counter experimentation.

If you want to know about other affordarable Air Quality Sensors such as Shinyei and Samyoung, check our sensor overview page.

Real-time data

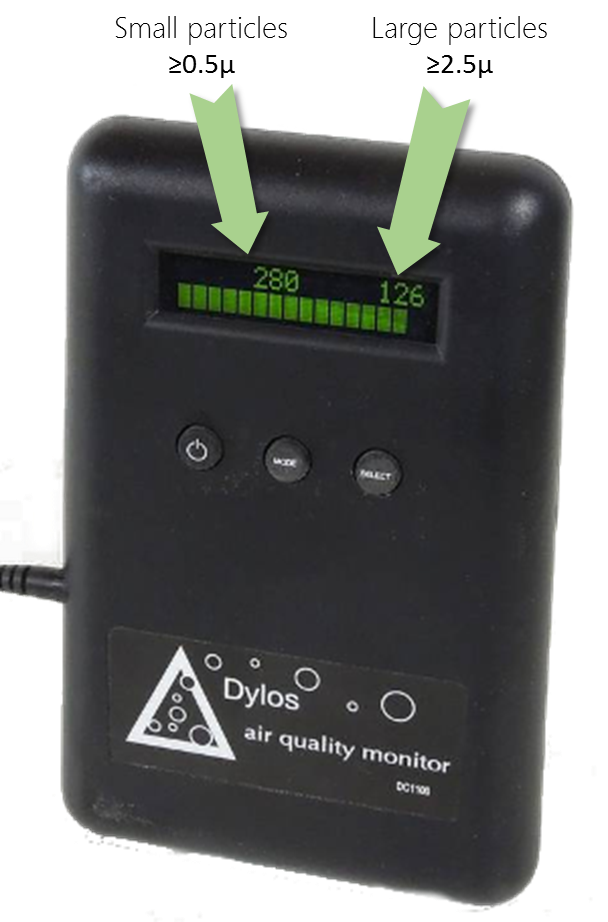
Current dylos readings are: Particules larger than 0.5 is -, larger than 2.5 is -, updated on - - (China time).

Those values are expressed in number of particules per 0.01 cubic foot (100.n/ft3), i.e. same as what is displayed on the Dylos LCD.

Time series graphs

The following two graphs show the last 30 days data correlation for the Beijng Sanlitun Dylos monitor (in blue) and Beijing Chaoyang Agricultural Exhibition Hall (朝阳农展馆) BAM monitor (in red).

Note that the comparison between Dylos and BAM readings is done for Dylos ≥ 0.5u with PM2.5 and Dylos ≥ 2.5u with PM10. You might think that comparing readings for Dylos ≥ 2.5u and PM2.5 might be more relevant, but this is actually not the case. The explanation is given in the experiment ' what is the dylos monitor actually measuring'.


Variation between stations

The next 2 graphics show the PM2.5 and PM10 raw values (in µg/m3) for different BAM stations (i.e. without the Dylos values) in Beijing, for the last 10 days. This is provided to ensure that there is not significant devitation between the various stations, especially considering that some are located on the road side, while others are in the living area.

CAC Chaoyang Agritculture Center (朝阳农展馆), BAM PM.25 in µg/m3
COSC Chaoyang Olympic Sports Center (朝阳奥体中心), BAM PM2.5 in µg/m3
DCDS Dongcheng Dongsi (东城东四), BAM PM2.5 in µg/m3
US Emb US Embassy (美国大使馆), BAM PM2.5 in µg/m3


- -

For the list of all air quality sensors, check the Sensor Overview page

Read or publish comments (they rely on Disqus)

Hava Kalitesi ve Kirlilik Ölçümü Hakkında:

Hava Kalitesi Seviyeleri Hakkında

- Hava Kalitesi İndeksi (AQI) DeğerleriSağlık Endişesinin Düzeyleri
0 - 50 İyi Hava kalitesi tatmin edici kabul edilmekte ve hava kirliliği çok az veya hiç risk oluşturmamakta.
51 -100 Orta Hava kalitesi kabul edilebilir; ancak bazı kirleticiler hava kirliliğine karşı alışılmadık derecede hassas olan çok az sayıda insan için orta derecede sağlık sorunu oluşturabilir.
101-150 Sağlıksız hassas gruplar için Hassas gruplar sağlık sorunları yaşayabilir. Genel halkın etkilenmesi olası değildir.
151-200 Sağlıksız Herkesin sağlığı etkilenmeye başlayabilir; hassas gruptakiler daha ciddi sağlık etkileri yaşayabilir
201-300 Çok sağlıksız Acil durum sağlık uyarıları. Tüm nüfusun etkilenmesi daha olasıdır.
300+ Tehlikeli Sağlık uyarısı: Herkes daha ciddi sağlık etkileri yaşayabilir

Hava Kalitesi ve Kirlilik hakkında daha fazla bilgi edinmek için Wikipedia Hava Kalitesi konusuna veya Airnow Hava Kalitesi ve Sağlığınız kılavuzuna bakın.

Pekin Doktoru Richard Saint Cyr MD'nin çok faydalı sağlık tavsiyeleri için www.myhealthbeijing.com bloguna bakın.


Kullanım Uyarısı: Hava Kalitesi verileri yayınlandıkları esnada doğrulanmamıştır ve kalite güvencesi nedeniyle bu veriler herhangi bir zamanda haber verilmeksizin değiştirilebilir. Dünya Hava Kalitesi Endeksi projesi, bu bilgilerin içeriğinin derlenmesinde tüm makul beceriyi ve özeni göstermiştir ve hiçbir koşulda Dünya Hava Kalitesi İndeksi proje ekibi veya temsilcileri, bu verilerin temininden doğrudan veya dolaylı olarak doğan herhangi bir kayıp, yaralanma veya hasar için taahhüt, tazmin veya başka bir şekilde sorumlu tutulamaz.


Settings


Language Settings:


Temperature unit:
Celcius