The Dylos Air Quality Sensor experiment

اشتراک گذاری: aqicn.org/sensor/beijing/sanlitun/fa/
Introduction

For more information about those real-time dylos and BAM monitor PM2.5 and PM10 readings, please refer to our article on the Dylos Air Particule Counter experimentation.

If you want to know about other affordarable Air Quality Sensors such as Shinyei and Samyoung, check our sensor overview page.

داده های زمان واقعی

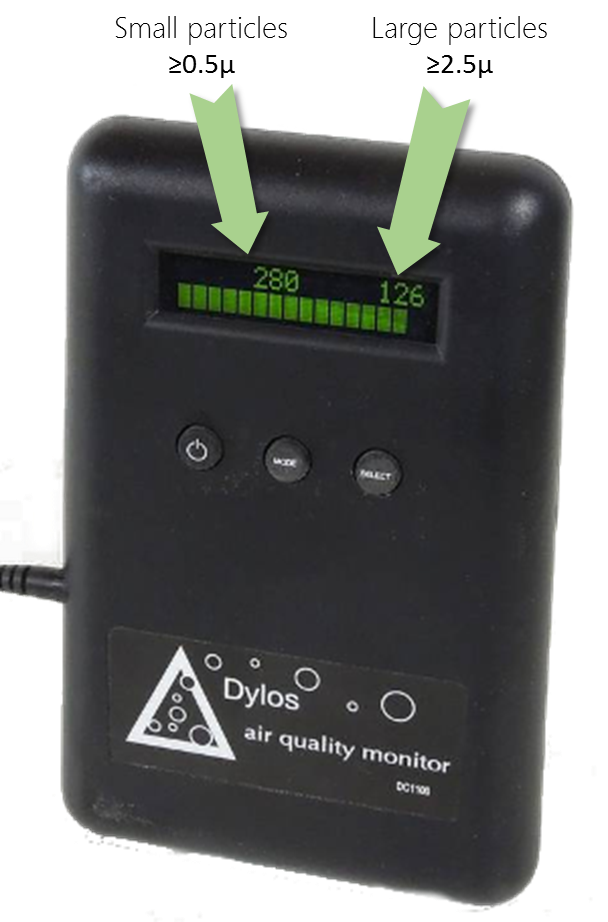
Current dylos readings are: Particules larger than 0.5 is -, larger than 2.5 is -, updated on - - (China time).

Those values are expressed in number of particules per 0.01 cubic foot (100.n/ft3), i.e. same as what is displayed on the Dylos LCD.

Time series graphs

The following two graphs show the last 30 days data correlation for the Beijng Sanlitun Dylos monitor (in blue) and Beijing Chaoyang Agricultural Exhibition Hall (朝阳农展馆) BAM monitor (in red).

Note that the comparison between Dylos and BAM readings is done for Dylos ≥ 0.5u with PM2.5 and Dylos ≥ 2.5u with PM10. You might think that comparing readings for Dylos ≥ 2.5u and PM2.5 might be more relevant, but this is actually not the case. The explanation is given in the experiment ' what is the dylos monitor actually measuring'.


Variation between stations

The next 2 graphics show the PM2.5 and PM10 raw values (in µg/m3) for different BAM stations (i.e. without the Dylos values) in Beijing, for the last 10 days. This is provided to ensure that there is not significant devitation between the various stations, especially considering that some are located on the road side, while others are in the living area.

CAC Chaoyang Agritculture Center (朝阳农展馆), BAM PM.25 in µg/m3
COSC Chaoyang Olympic Sports Center (朝阳奥体中心), BAM PM2.5 in µg/m3
DCDS Dongcheng Dongsi (东城东四), BAM PM2.5 in µg/m3
US Emb US Embassy (美国大使馆), BAM PM2.5 in µg/m3


- -

For the list of all air quality sensors, check the Sensor Overview page

Read or publish comments (they rely on Disqus)

درباره اندازه گیری کیفیت و آلودگی هوا:

درباره سطوح کیفیت هوا

- مقادیر شاخص کیفیت هوا (AQI).سطوح نگرانی سلامت
0 - 50 خوب کیفیت هوا رضایتبخش است و آلودگی هوا کم یا بدون خطر است
51 -100 در حد متوسط کیفیت هوا قابل قبول است با این حال، برای بعضی از آلاینده ها ممکن است نگرانی سلامت متوسط برای تعداد بسیار کمی از افرادی که به طور غیر منتظره ای نسبت به آلودگی هوا حساس هستند، وجود داشته باشد.
101-150 ناسالم برای گروه های حساس سلامتی گروه های حساس ممکن است تحت تاثیر قرار بگیرد.عموم مردم احتمالا تحت تاثیر قرار نخواهند گرفت.
151-200 ناسالم همه ممکن است اثرات آلودگی بر سلامتیشان را احساس کنند؛ اعضای گروه های حساس ممکن است اثرات منفی جدی تری بر سلامتی شان احساس کنند.
201-300 خیلی ناسالم هشدارهای بهداشتی در شرایط اضطراری. کل جمعیت بیشتر احتمال دارد تحت تأثیر قرار گیرد.
300+ خطرناک هشدار سلامت: هرکس ممکن است اثرات جدی سلامتی را تجربه کند

برای اطلاعات بیشتر در مورد کیفیت هوا و آلودگی، موضوع کیفیت هوا در ویکی‌پدیا یا راهنمای airnow برای کیفیت هوا و سلامت شما را بررسی کنید.

برای توصیه های بهداشتی بسیار مفید دکتر پکن ریچارد سنت سیر، وبلاگ www.myhealthbeijing.com را بررسی کنید.


اطلاعیه درمورد شرایط استفاده: تمام اطلاعات کیفیت هوا در زمان انتشار تایید نشده است و با توجه به عدم اطمینان از کیفیت این اطلاعات ممکن است بدون اطلاع قبلی در هر زمانی اصلاح شود. پروژه شاخص کیفیت جهانی هوا با استفاده از تمام مهارت ها و مراقبت های معقول در انتشار محتویات این اطلاعات، تحت هیچ شرایطی شاخص کیفیت جهانی هوا تیم پروژه یا نمایندگان آن برای هر گونه از دست دادن، آسیب یا آسیب ناشی از عرضه اطلاعات مسئولیتی را قبول نمی‌کنند.


Settings


Language Settings:


Temperature unit:
Celcius