The Dylos Air Quality Sensor experiment

падзяліцца: aqicn.org/sensor/beijing/sanlitun/be/
Introduction

For more information about those real-time dylos and BAM monitor PM2.5 and PM10 readings, please refer to our article on the Dylos Air Particule Counter experimentation.

If you want to know about other affordarable Air Quality Sensors such as Shinyei and Samyoung, check our sensor overview page.

Real-time data

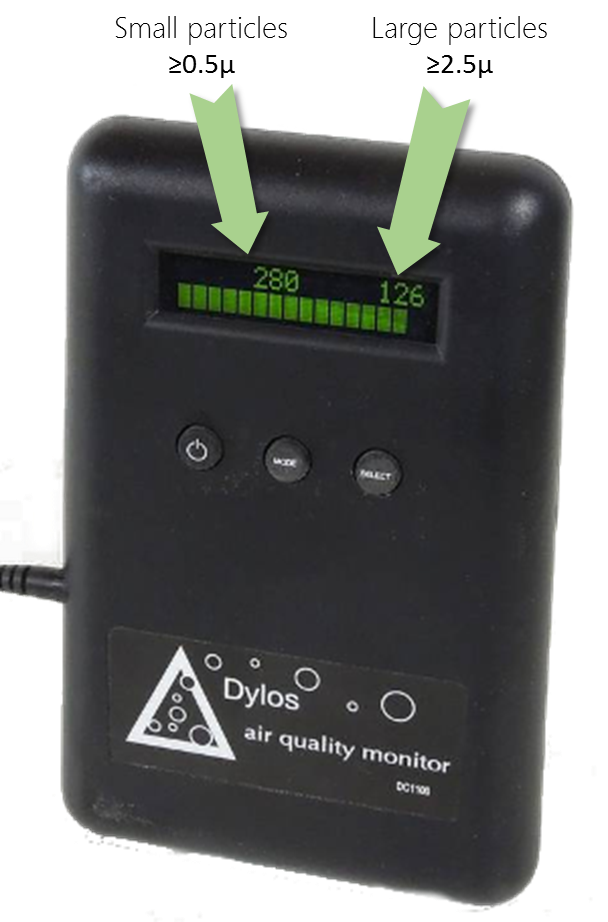
Current dylos readings are: Particules larger than 0.5 is -, larger than 2.5 is -, updated on - - (China time).

Those values are expressed in number of particules per 0.01 cubic foot (100.n/ft3), i.e. same as what is displayed on the Dylos LCD.

Time series graphs

The following two graphs show the last 30 days data correlation for the Beijng Sanlitun Dylos monitor (in blue) and Beijing Chaoyang Agricultural Exhibition Hall (朝阳农展馆) BAM monitor (in red).

Note that the comparison between Dylos and BAM readings is done for Dylos ≥ 0.5u with PM2.5 and Dylos ≥ 2.5u with PM10. You might think that comparing readings for Dylos ≥ 2.5u and PM2.5 might be more relevant, but this is actually not the case. The explanation is given in the experiment ' what is the dylos monitor actually measuring'.


Variation between stations

The next 2 graphics show the PM2.5 and PM10 raw values (in µg/m3) for different BAM stations (i.e. without the Dylos values) in Beijing, for the last 10 days. This is provided to ensure that there is not significant devitation between the various stations, especially considering that some are located on the road side, while others are in the living area.

CAC Chaoyang Agritculture Center (朝阳农展馆), BAM PM.25 in µg/m3
COSC Chaoyang Olympic Sports Center (朝阳奥体中心), BAM PM2.5 in µg/m3
DCDS Dongcheng Dongsi (东城东四), BAM PM2.5 in µg/m3
US Emb US Embassy (美国大使馆), BAM PM2.5 in µg/m3


- -

For the list of all air quality sensors, check the Sensor Overview page

Read or publish comments (they rely on Disqus)

Пра якасць паветра і вымярэнне забруджвання:

Пра ўзровень якасці паветра

- Значэнні індэкса якасці паветра (AQI).Узроўні занепакоенасці здароўем
0 - 50 добра Якасць паветра лічыцца здавальняючым, і забруджванне паветра ўяўляе мала або няма рызыкі
51 -100 ўмераны Якасць паветра з'яўляецца прымальным; Аднак, для некаторых забруджвальных рэчываў можа быць умераным турботай здароўя для вельмі невялікай колькасці людзей, якія незвычайна адчувальныя да забруджвання паветра.
101-150 Нездаровы для адчувальных груп Члены адчувальных груп могуць адчуваць наступствы для здароўя. Шырокая грамадскасць, хутчэй за ўсё, будуць закрануты няма.
151-200 нездаровы Кожны можа пачаць адчуваць ўздзеянне на здароўе; Члены адчувальных груп могуць адчуваць больш сур'ёзныя наступствы для здароўя
201-300 Вельмі Нездаровы папярэджання для здароўя надзвычайных сітуацый. Усё насельніцтва, хутчэй за ўсё, будуць закрануты.
300+ небяспечны Небяспечна для здароўя: кожны можа адчуваць больш сур'ёзныя наступствы для здароўя

Каб даведацца больш пра якасць паветра і забруджванне, азнаёмцеся з тэмай Вікіпедыі «Якасць паветра» або кіраўніцтвам airnow «Якасць паветра і ваша здароўе» .

Вельмі карысныя парады па здароўі ад доктара медыцынскіх навук з Пекіна Рычарда Сэн-Сіра глядзіце ў блогу www.myhealthbeijing.com .


Апавяшчэнне аб выкарыстанні: Усе дадзеныя па якасці паветра з'яўляюцца неправеранымі на момант публікацыі, і ў сувязі з забеспячэннем якасці гэтых дадзеныя могуць быць зменены без папярэдняга паведамлення ў любы час. World Air Індэкс якасці Праект ажыццяўляецца ўсе разумныя навыкі і сыход пры складанні зместу гэтай інфармацыі і ні пры якіх абставінах не World Air Індэкс якасці каманда праекта або яго агенты нясуць адказнасць у кантракце, деликта ці іншым чынам за любыя страты, пашкоджанні або шкоду, прама ці ўскосна ад крыніцы гэтых дадзеных.


Settings


Language Settings:


Temperature unit:
Celcius