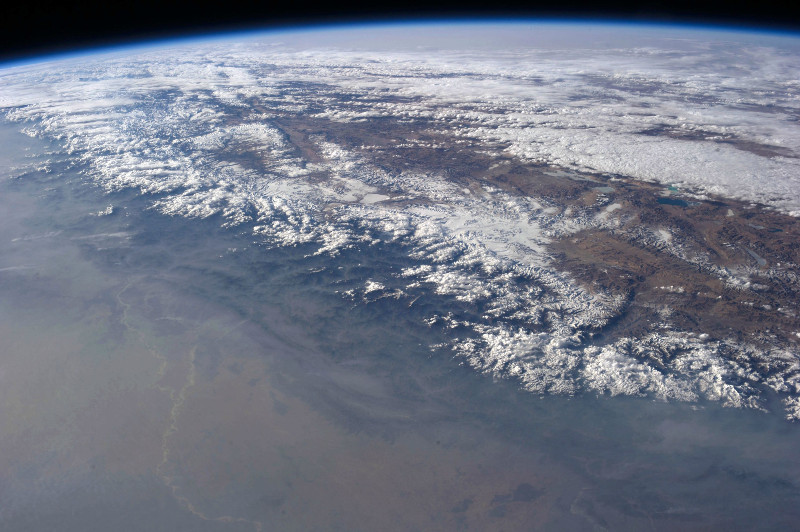
Himalayan Mountains seen from Space
During the past months, the World Air Quality team has been working on analyzing several new Air Quality forecast models, as well as improving the Air Quality forecast model demonstrator.
This article will present the latest forecast model demonstrator, which is based on the Gridded Population of the World (GPW), and which will be applied to analyze the Air Quality forecast for the Northern India region (including Bangladesh, Pakistan and Nepal).
--
The forecast model and computation is still based on the GFS Wind Forecast, as we demontrated in the previous article about the forecast in Beijing region that the wind is an essential component for Air Quality forecasting.
However, unlike in the previous simulation where the pollution sources where arbitrarily located in specific locations in the Hebei region, the model used for this Northern India forecast is based on the Gridded Population of the World (aka GPW 2015) from the University of Columbia CIESIN[1]:
The assumption is that the higher the number of person living in a given area, the higher the chance of anthropogenic pollution beeing generated.
It is indeed not a 100% correct assumption since the pollution generated by heavy industries can be much higher than the pollution generated by the population, but that's something we will address in our next article. So, for this article, what is wanted is to verify the impact of wind on the pollution under the assumption of a correlation between population density and pollution concentration.
--
The image below is showing the density model (at 0.2° resolution) used for the simulation. Each "pixel", or point on this gridded map, is considered as a pollution source. The green color is used for low density regions, which are generating very small amount of pollution, while darker colors represent zones where both population and generated pollution is higher.
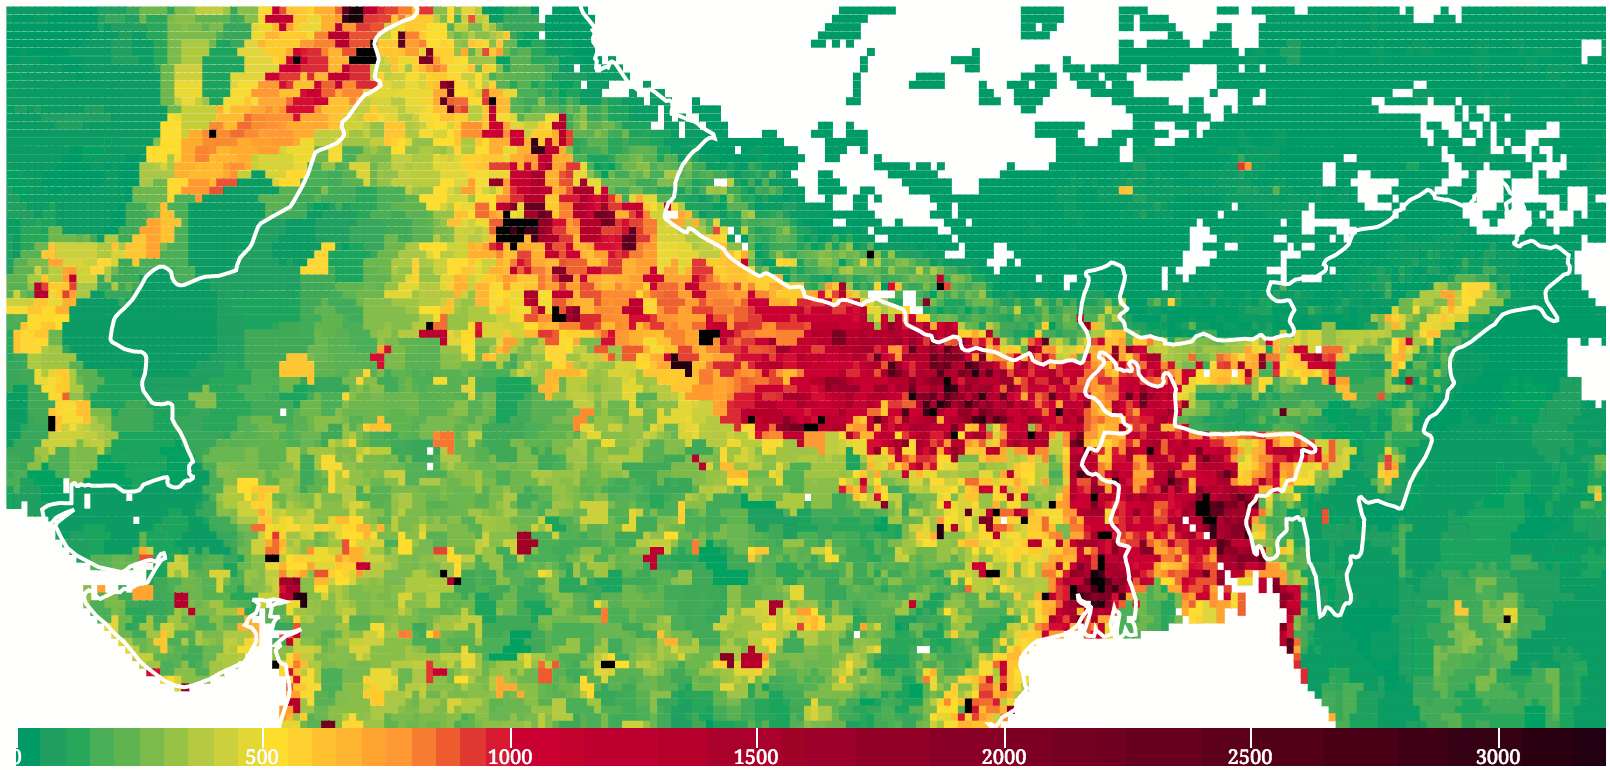
Population Density (persons per square meter)
The animation below is showing the real-time concentration based on actual[2] wind data. Note that the color coding and the associated concentration levels is arbitrary - and can not (and should not) be associated one-to-one to AQI levels without further work. The essential idea is to plot the zones which are more likely to have high or very high pollutant concentration based on the wind condition forecast.
--
-
--
Without too much surprise, New Delhi is seeing a high level of pollution concentration, but what is really interesting is to compare the situation in New Delhi compared to Beijing: In Beijing, there is literally almost no anthropogenic pollution in the near north, so, when the wind blows from the north, the air gets immediately cleaned. But for New Delhi the population density in the north in still quite high, so the chance of getting immediate clean air from the North are much lower. In order words, New Delhi requires a much higher amount of ventilation (or cumulated wind power) to get its air cleaned-up.
The second observation is the situation in Bangladesh: From the above simulation, the pollution is getting obviously trapped in Bangladesh by the proximity of mountains in the East and North. That's actually not a surprise to anyone who has been living in Dhaka.
Unfortunately, there is actually not any available monitoring stations in Bangladesh / Dhaka at the time of writing, so it is not possible to verify forecast accuracy vs the actual observations.
(Note: Few days after this article was written, the US Consultate in Dhaka started to publish their Air Quality Data, which you can find from this link: city/bangladesh/dhaka/us-consulate).
For more information about the Air Quality in Bangladesh, you can refer to this page: country/bangladesh/cs/.
--
As a conclusion, this forecast model is still far from being complete, but at least, it has the advantage of showing the impact of wind the pollution concentration in Northern India, and especially how the Himalayan mountains are trapping the air pollution. In the next version, we will introduce a enhanced version for the pollution sources, taking into account known positive flux which we can be deducted from observations.
--
Note: In order to get the real-time forecast viewer to be able to handle such a wide region, our team had to work hard on a quite a few improvements and optimizations. We are now working on an even further optimized version able to handle more than 10K particles, and we are considering making its code open source, so if you are interested, drop us a message via the "discuss" board below (we will will only make it open source only if there is enough demand for it).
