In April 2014, the Singapore NEA has updated the PSI calculation to also include PM2.5. http://www.nea.gov.sg/anti-pollution-radiation-protection/air-pollution-control/psi
With the recent Southeast Asia Smog from Indonesia affecting Singapore and now Malaysia, we got many questions about why there is a difference between the data which can be read from Singapore NEA website (nea.gov.sg) and the World Air Quality Index project Singapore webpage.
به عنوان مثال، آنچه را می توان امروز در وب سایت NEA خواند:
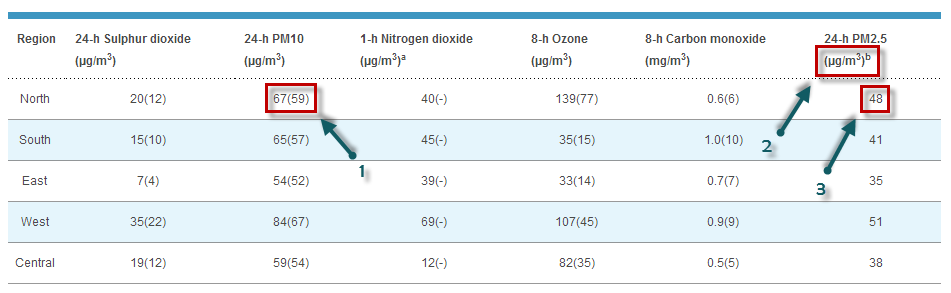
بنا به دلایل تاریخی، سنگاپور از PSI ( شاخص استاندارد آلاینده ) برای ارزیابی کیفیت هوا استفاده می کند. در تصویر بالا، عدد 1 مربوط به مقدار PM10 است که برای ارزیابی PSI استفاده می شود. مقدار 67(/59) را می توان به عنوان 67 میکروگرم بر متر مکعب خواند که مربوط به PSI 59 است. PSI به عنوان حداکثر PSI فردی برای هر یک از آلاینده ها ارزیابی می شود: PM 10 ، SO 2 ، NO 2 ، O. 3 (ازون) و CO 2 .
PSI(Singapore-North) = max( PSIPM10-based, ... PSIO3-based )= max (59, ..., 77) = 77
نکته جالب این است که در همین جدول، داده های PM2.5 نیز در ستون آخر ارائه شده است (نگاه کنید به 3). این داده ها فقط در میکروگرم بر متر مکعب ارائه می شوند (نگاه کنید به 2)، و هیچ تبدیلی به چیزی شبیه PSI (یعنی تبدیل از جرم PM2.5 به شاخص آلودگی یا کیفیت) وجود ندارد. با این حال، این تبدیل وجود دارد و توسط آژانس حفاظت از محیط زیست ایالات متحده تعریف شده است. ساده ترین راه برای انجام تبدیل استفاده از ماشین حساب آنلاین موجود در airnow.gov است:
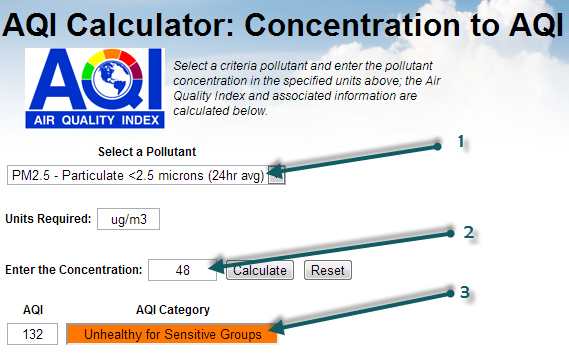
If you select the PM2.5 (1), then enter the mass concentration of 48 (2), can click on Calculate, you will obtain the AQI of 132 (3). So, based on the PM2.5 AQI conversion, the PSI that is used for Singapore could be extended (let's call it PSI++) to also take into account the PM2.5 information. In which case, the PSI++ would be the maximum of the regular PSI (based on PM10 only) and the PM2.5 AQI:
PSI++ = max( PSI, AQIPM.25 ) = max( 77, 132 ) = 132
This PSI++, that is commonly referred as AQI (or Air Quality Index), is what is being used on the the World Air Quality Index project, for all the cities (provided PM2.5 is available for the city). And this explains why the values are different between the NEA website and the World Air Quality Index project.
Moreover, when doing the convertion, make sure you use the 1-hour reading for the PM2.5 concentration rather than the 24-hours averaged value, as shown on the below image:
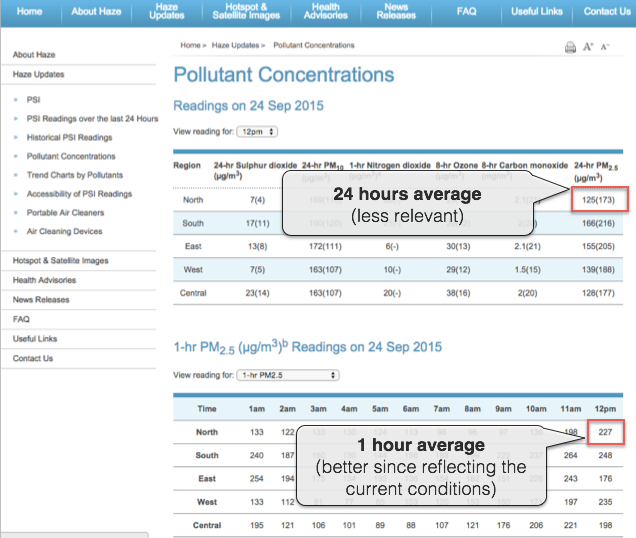
http://www.haze.gov.sg/haze-updates/pollutant-concentrations/type/PM25-1Hr
If you want to know more about PM10 vs PM2.5, and especially why PM10 is still used, please check the faq entry about why is PM2.5 often higher than PM10? Is PM10 still a relevant measure?
--
For more information about specific countries or continent, please refer to those articles: Thailand and Malysia - India - China - Hong Kong / Canada (Air Quality Health Index) - South America - Australia - Quebec and Montreal - Singapore - Poland - Indonesia .
For information about the 24 hours averaging used or Ozone and Particulate Matter (PM2.5), please refer to those two articles: Ground Ozone Index - PM2.5 Instant Cast

