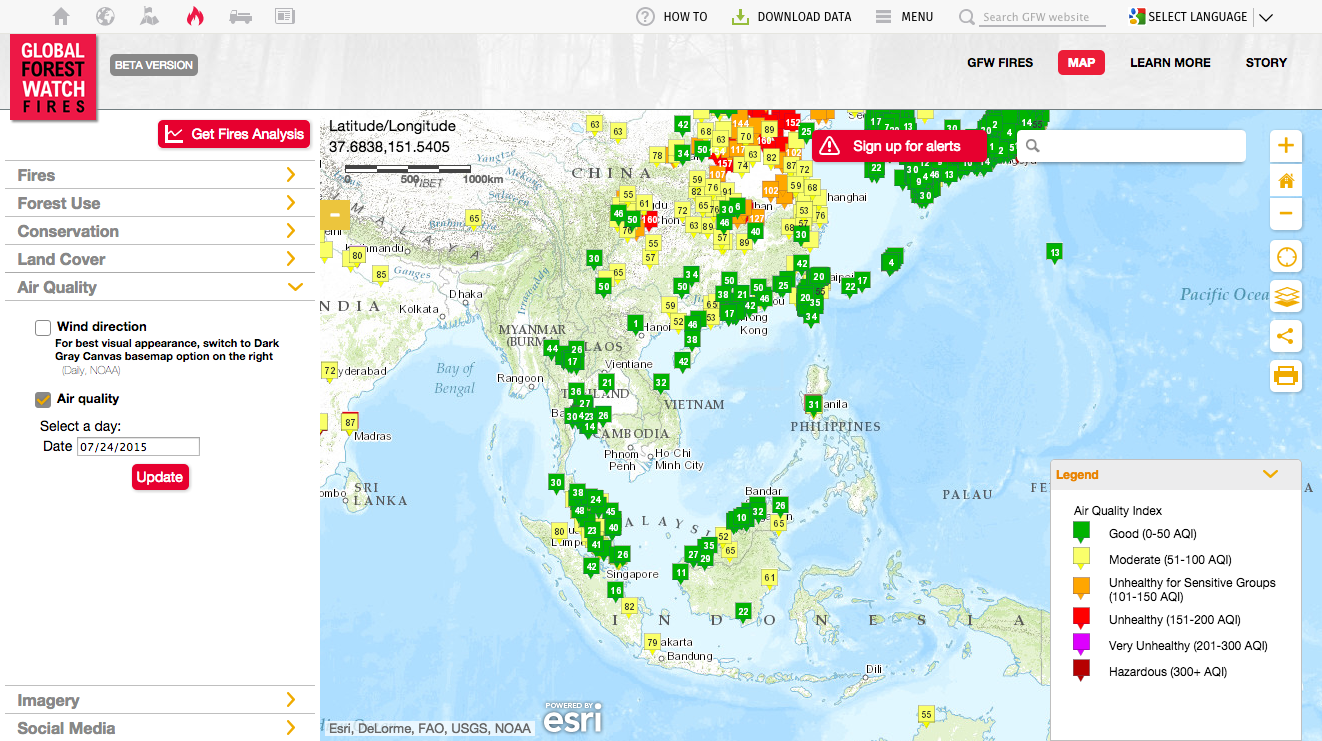
当社は最近、世界中でさらに多くの EPA (環境保護機関) と協力しています。私たちに寄せられたすべての要望の中で、実際には、EPA 自身がウェブサイトから地図上にリアルタイムの大気質データを含めることができるように、ウェブ マップ サービスを提供することです。
当社のこのような地図 Web サービスを使用する明らかな利点の 1 つは、当社が収集している国境を越えたデータの恩恵を受けることです。つまり、国境の制限なく世界規模の大気質情報が提供されます。
2 番目の利点は、これが無料のサービスであるだけでなく、Google、Bing、リーフレットなどの標準地図技術と完全に互換性があり、既存の Web サイトと迅速かつ簡単に統合できることです。
--
タイル マップ サービス エンドポイント
タイル マップ サーバーは、URL `https://tiles.aqicn.org/tiles/{aqi}/{z}/{x}/{y}.png` から入手できます。ここで、 aqiマーカーのタイプを指します。プロットすることができます。
usepa-aqi: Plots markers based on the composite AQI calculated with the US EPA standard.usepa-pm25: PM2.5 based AQI - if a station does not have PM2.5 reading, then it is not plotted.usepa-10: Same as above, but for PM10.usepa-o3: Same as above, but for Ozone (based on the 1 hour breakpoints).usepa-no2: Same as above, but for Nitrogen Dioxide.usepa-so2: Same as above, but for Sulfur Dioxide.usepa-co: Same as above, but for Carbon Monoxide.asean-pm10: Asean PM10 raw PM10 concentration (explanations).
以下は、中国南部の 6 つの個別の汚染物質の例です。
Webサービス利用条件
地図 Web サービスは、合理的な使用制限と許容される使用ポリシーの条件の下で、無料で提供されます。現在、タイルは 15 分ごとに更新されます (トラフィックが多い場合は最大 1 時間)。
当社のサーバー容量には限りがあるため、サーバーのパフォーマンス メンテナンスなどのため、いつでもサービスを一時停止する権利を留保します。より安定した統合が必要な場合は、専用サーバーのセットアップなど、適切なソリューションを見つけるために当社にお問い合わせください。
最後に、次の URL の `token=_TOKEN_ID_` のように、タイル サービス エンドポイントへの追加の引数として独自のトークン ID を指定する必要もあります: `https://tiles.aqicn.org/tiles/{aqi}/{z }/{x}/{y}.png?トークン=_TOKEN_ID_ `。
このページから独自のトークン ID をリクエストできます。有効な電子メールを入力するだけで、1 分以内に独自のトークンを取得できます。
Webサービス利用制限

サービスを使用するときは、世界大気質指数プロジェクトへの帰属と、データを提供する EPA を忘れずに提示してください (マップ サービスを使用して特定の場所またはソースからのデータを表示する場合)。すべての EPA の完全なリストは、このリンクから入手できます。
実際のところ、世界資源研究所(WRI) のように行動しないでください。彼らは私たちのデータ フィード全体を廃棄し、私たちの仕事の帰属を一切示さずにデータを独自のプロジェクト Web サイトに再公開していました... それはまったく問題ありません彼らが毎年最大8,000万ドルの資金を得ていることを知っているとき。私たちのことを信じられないのですか?このスナップショットを確認してください。
将来の拡張
私たちはすでに、この Web サービスを拡張して、より多くの構成を提供することに取り組んでいます。例えば:
- To support for more standards other than the US EPA, such as `eucaqi-xxx` for the European Common Air Quality Index, `innaqi-xxx` for the Indian National Air Quality Index , `raw-xxx` for the unconverted raw data, etc.
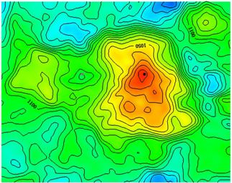
wind(現在の風速と風向の両方) や、予測に非常に役立つventilation指数[1]などのその他の指標。- 地理統計的サーフェス推定の
krigingのサポート - つまり、ヒートマップのような補間 (右の図) は、低密度の監視ネットワークに役立ちます。 24 hoursおよび8 hoursデータ平均化をサポートします。私たちのマップは現在 1 時間の平均に基づいていますが、疫学研究にはより長い平均期間が役立ちます。GeoJSONベースのタイル レンダリングのサポートにより、マーカーとカラー スケールのカスタマイズが可能になるほか、 tuftjs.orgなどのツールとの統合が強化されます。
より多くの AQI 標準とタイル構成をサポートするには、サーバー容量 (処理能力とストレージの両方) を増やす必要があり、そのためにはスポンサーシップが必要になることに注意してください。あなたが大規模なクラウド会社、たとえば Google や Microsoft に勤めていてこのメッセージを読んでいるのであれば、会社を環境に優しいものにし (市民の意識を高めることで大気汚染と戦う)、必要なサーバーの一部をスポンサーすることを検討してみてはいかがでしょうか。余分な容量?それは私たちを助けるだけでなく、環境データや科学を扱う研究者、科学者、統計学者、疫学者のコミュニティ全体を助けることにもなります。
--

サンプルコード: Leaflet との統合
Leaflet は、 MapBox の Vladimir Agafonkin によって作成された、モバイル対応のインタラクティブ マップ用の非常にクールな軽量オープンソース JavaScript ライブラリです。
<div id='map' style='height:380px;' />
<link rel="stylesheet" href="http://cdn.leafletjs.com/leaflet-0.7.5/leaflet.css" />
<script src="http://cdn.leafletjs.com/leaflet-0.7.5/leaflet.js"></script>
<script>
var OSM_URL = 'http://{s}.tile.openstreetmap.org/{z}/{x}/{y}.png';
var OSM_ATTRIB = '© <a href="http://openstreetmap.org/copyright">OpenStreetMap</a> contributors';
var osmLayer = L.tileLayer(OSM_URL, { attribution: OSM_ATTRIB });
var WAQI_URL = "https://tiles.waqi.info/tiles/usepa-aqi/{z}/{x}/{y}.png?token=_TOKEN_ID_";
var WAQI_ATTR = 'Air Quality Tiles © <a href="http://waqi.info">waqi.info</a>';
var waqiLayer = L.tileLayer(WAQI_URL, { attribution: WAQI_ATTR });
var map = L.map('map').setView([51.505, -0.09], 11);
map.addLayer(osmLayer).addLayer(waqiLayer);
</script>
サンプルコード: Google との統合
Google マップは非常に便利で、1 日あたり最大 25,000 回の API 呼び出しは無料です。 Google マップは中国でも利用できますが、マップ API スクリプトは通常の https://maps ではなく google.cn (`http://maps.google.cn/maps/api/js`) からロードする必要があることに注意してください。 .googleapis.com/maps/api/js URL。
<div  id='map'  style='height:380px;'  />
<script  src="https://maps.googleapis.com/maps/api/js"></script>

<script>
      var  map  =  new  google.maps.Map(document.getElementById('map'),  {
            center:  new  google.maps.LatLng(51.505,  -0.09),
            mapTypeId:  google.maps.MapTypeId.ROADMAP,
            zoom:  11
      });

      var  t  =  new  Date().getTime();
      var  waqiMapOverlay  =  new  google.maps.ImageMapType({
            getTileUrl:  function  (coord,  zoom)  {
                  return  'https://tiles.aqicn.org/tiles/usepa-aqi/'  +  zoom  +  "/"  +  coord.x  +  "/"  +  coord.y  +  ".png?token=_TOKEN_ID_";
            },
            name:  "Air  Quality",
      });

      map.overlayMapTypes.insertAt(0,  waqiMapOverlay);
</script>
サンプルコード: Microsoft Bing Maps との統合
Bing マップは実際には非常に優れており、一部の国では Here ベース マップも使用しています。 Microsoft Maps に基づいた Web サイトは依然として数多く存在します (特に大気質と天気の分野では)。
<div  id='map'  style='height:380px;'    style='position:relative;'/>
<script  type='text/javascript'  src='https://www.bing.com/api/maps/mapcontrol?callback=initBingMap'  async  defer></script>

<script>
      function  initBingMap()  {

            var  map  =  new  Microsoft.Maps.Map(document.getElementById('map'),  {
                  center:  new  Microsoft.Maps.Location(51.505,  -0.09),
                  zoom:  11,
            });

            var  options  =  {
                  uriConstructor:  "https://tiles.aqicn.org/tiles/usepa-aqi//{zoom}/{x}/{y}.png?token=_TOKEN_ID_",
                  minZoom:  1,
                  maxZoom:  15
            };
            var  waqiTileSource  =  new  Microsoft.Maps.TileSource(options);
            var  waqiTilelayer  =  new  Microsoft.Maps.TileLayer({  mercator:  waqiTileSource  });
            map.layers.insert(waqiTilelayer);
      }
</script>