The Shinyei experiment
Real-time Air Quality readings from Beijing

Μερίδιο: aqicn.org/sensor/shinyei/el/
For a complete list of all the Air Quality Sensors test on the World Air Quality Index project, check our sensor overview page.

Introduction

For more information about those real-time dylos and BAM monitor PM2.5 and PM10 readings, please refer to our article on the Dylos Air Particule Counter experimentation.


If you want to know about other affordarable Air Quality Sensors such as Shinyei and Samyoung, check our sensor overview page.

Are cheap low-cost air quality sensor really worth?

There are many affordable and low-cost air particule sensor. The most famous one is definitely the Japanese Shinyei sensor, with a cost of around 75 CNY (12 USD), and it's Korean copy, the Samyoung sensor, with a cost of around 35 CNY (5.5 USD).

This objective of this experiement is to provide empiral data about the quality of those sensor, e.g. can they be used to acurately measure Air Quality, especially for outdoor data and polluted countries.

There are many research papers on this topic. The one most up-to-date at the time of writing is from David Holstius. Check it online here: field calibrations of a low cost aerosol sensor ( research paper).

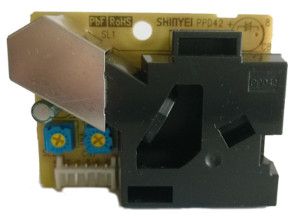
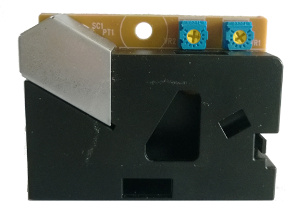
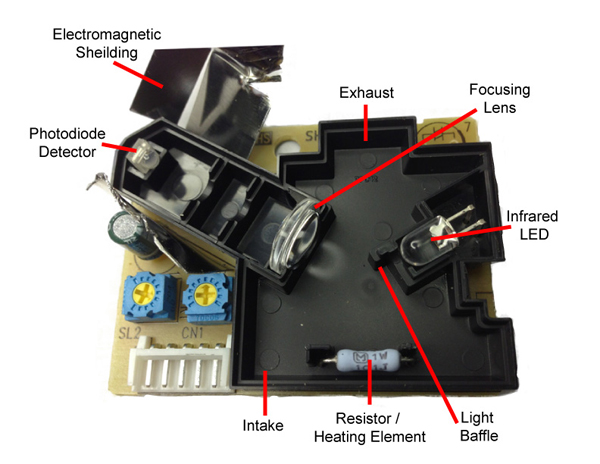
Inside the low-cost sensor

Compared to the Dylos monitor, one could say that low-cost sensors are more like measuring the air opacity rather than individual particles:

The Dylos monitor works by counting individual particles, and classifying them by size (smaller than 0.5 and smaller than 2.5). By doing so, it is able to provide accurate values about the exact amount of dust particles in the air. And by knowing the typical "dust" type that is being measured, is it somewhat straight forward to deduct the total mass of particles.

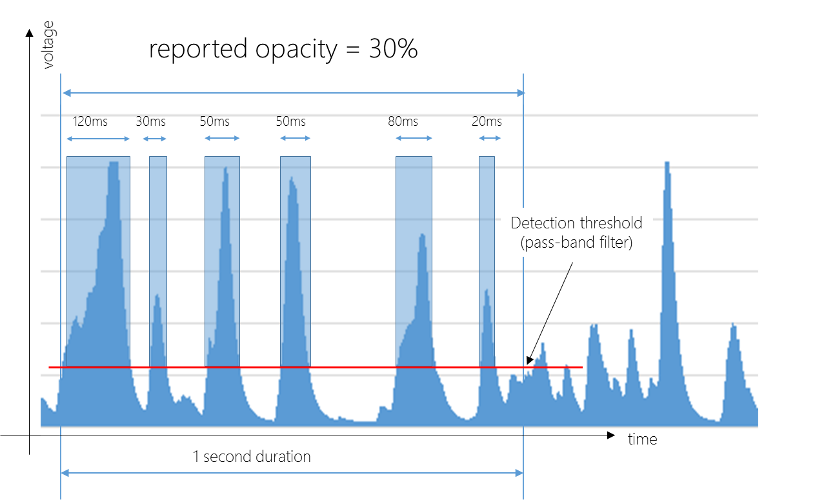
The low-cost sensor, on the contrary, are not counting individual particles, but instead, counting the amount of time particles are detected by the photo diode sensor. The graph below represents how the Shinyei is "calculating" the air quality: First, it applies a pass band filter to remove very small particles or noise, which is represented by the red line. Then, independently of the intensity (or particle size), it counts the amount of time any particle is seen. This amount of time, also called "Low Pulse Occupancy" (LPO), can be considered as the "opacity percentage" of the air circulating through the sensor. In order to measure the LPO for different particles sizes, the sensor provide a variable input which allows to adjust the pass-band filter.

Shinyei PPD42NS raw diode reading
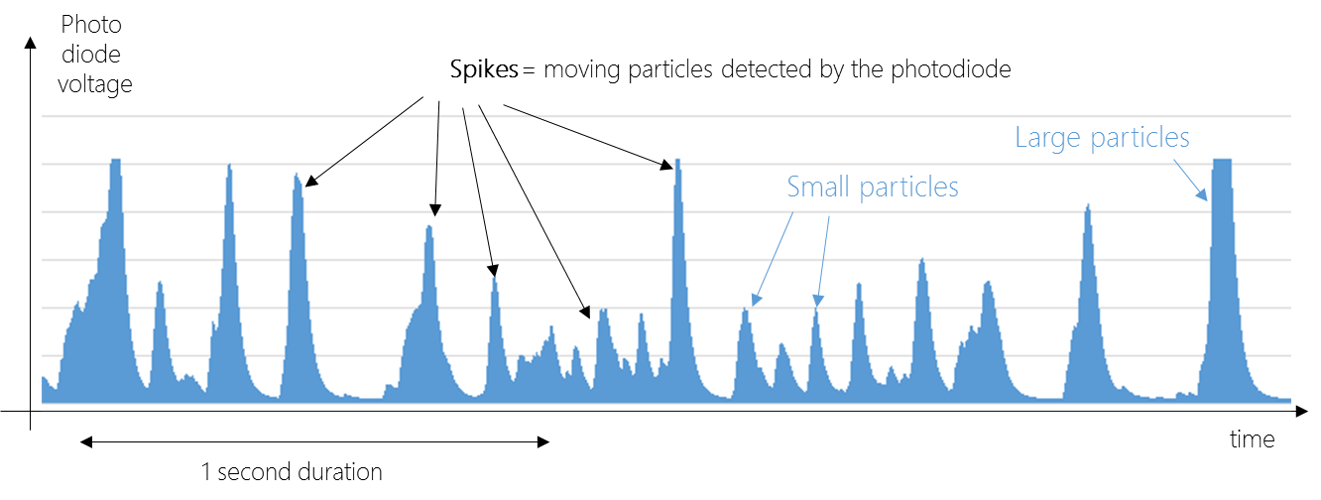
Shinyei PPD42NS raw diode reading (in volts)

Shinyei PPD42NS raw LPO reading
Shinyei PPD42NS raw LPO reading (in occupancy)

Ρύθμιση πειράματος


The low-cost particule counters used is this experiment are based on: The reference air quality meters are:
For the source code and hardware connectivity information, please refer to this page: aqicn.org/api/shinyei/.

Note (December 18th 2014): Due to a wrong setup, the data is from the Samyoung is currently not available - it will added again later. Also, this experiment has been updated to use both Shinyei output, which are supposed to be able to reflect small and large particles.

Δεδομένα σε πραγματικό χρόνο

Current Dylos readings are: Particules larger than 2.5 is -, larger than 0.5 is -, updated on - - (China time).

Current Shinyei readings are: LPO for particules larger than 1 is -, LPO for 2.5 is -, updated on - - (China time).

Time series graphs

From the previous graph (Shinyei vs. Samyoung), it is clear that the data generated by the Samyoung sensor is not at all reflecting actual air quality. In order to ensure that this issue is not caused by a deficient sensor, the sensor was replaced with a new one, but yet, no improvement were observed. For this reason, the Samyoung data will not be represented in the next plots. It is however interresting to notice that other resarch papers, such as the low-cost coarse airborne particulate matter sensing for indoor occupancy detection study (online ref) shows much better results for the Samyoung sensor, so this this something to be further investigated.

- -

Shinyei:
PM2.5 based Air quality data:
PM10 based Air quality data:

Initial findings

At first glance, the correlation for the Shinyei sensor seems to be much stronger from PM10 than PM2.5 readings. But, actually, it seems to be even more complicated since during some periods, the correlation to PM10 seems higher while for other periods, correlation to PM2.5 is higher. If this turns out to be true (which will require more data for the confirmation), that would mean that calculating the AQI from a Shinyei sensor could prove to be very arbitratary (see the PM10 vs. PM2.5 analysis).


- -

For the list of all air quality sensors, check the Sensor Overview page

Read or publish comments (they rely on Disqus)

Σχετικά με τη μέτρηση της ποιότητας του αέρα και της ρύπανσης:

Σχετικά με τα επίπεδα ποιότητας αέρα

- Τιμές του δείκτη ποιότητας αέρα (AQI).Επίπεδα ανησυχίας για την υγεία
0 - 50 Καλός Η ποιότητα του αέρα θεωρείται ικανοποιητική και η ατμοσφαιρική ρύπανση παρουσιάζει μικρό ή καθόλου κίνδυνο
51 -100 Μέτριος Η ποιότητα του αέρα είναι αποδεκτή. Ωστόσο, για ορισμένους ρύπους μπορεί να υπάρχει μέτρια ανησυχία για την υγεία για ένα πολύ μικρό αριθμό ατόμων που είναι ασυνήθιστα ευαίσθητα στην ατμοσφαιρική ρύπανση.
101-150 Ανθυγιεινό για ευαίσθητες ομάδες Τα μέλη ευαίσθητων ομάδων ενδέχεται να έχουν επιπτώσεις στην υγεία. Το ευρύ κοινό δεν είναι πιθανό να επηρεαστεί.
151-200 Ανθυγιεινός Ο καθένας μπορεί να αρχίσει να αντιμετωπίζει τις επιπτώσεις στην υγεία. τα μέλη ευαίσθητων ομάδων ενδέχεται να έχουν πιο σοβαρές επιπτώσεις στην υγεία
201-300 Πολύ Ανθυγιεινό Προειδοποιήσεις για την υγεία σε συνθήκες έκτακτης ανάγκης. Όλος ο πληθυσμός είναι πολύ πιθανόν να επηρεαστεί.
300+ Επικίνδυνος Προειδοποίηση για την υγεία: Όλοι μπορεί να έχουν πιο σοβαρές επιπτώσεις στην υγεία

Για να μάθετε περισσότερα σχετικά με την ποιότητα του αέρα και τη ρύπανση, ανατρέξτε στο θέμα της wikipedia για την ποιότητα του αέρα ή στον οδηγό airnow για την ποιότητα του αέρα και την υγεία σας .

Για πολύ χρήσιμες συμβουλές υγείας του γιατρού του Πεκίνου Richard Saint Cyr MD, ανατρέξτε στο ιστολόγιο www.myhealthbeijing.com .


Ειδοποίηση χρήσης: Όλα τα δεδομένα για την ποιότητα του αέρα δεν έχουν εγκριθεί κατά τη στιγμή της δημοσίευσης και, λόγω της διασφάλισης της ποιότητας, τα δεδομένα αυτά μπορούν να τροποποιηθούν χωρίς προειδοποίηση ανά πάσα στιγμή. Το έργο Παγκόσμιο Δείκτη Ποιότητας του Αερίου έχει ασκήσει όλες τις εύλογες δεξιότητες και φροντίδα κατά την κατάρτιση του περιεχομένου αυτών των πληροφοριών και σε καμία περίπτωση το Ομάδα Παγκόσμιας Ποιότητας Αέριας Ποιότητας ή οι αντιπρόσωποί της είναι υπεύθυνοι για συμβόλαιο, αδικοπραξία ή άλλως για τυχόν απώλειες, τραυματισμούς ή ζημίες που προκύπτουν άμεσα ή έμμεσα από την παροχή αυτών των δεδομένων.


Settings


Language Settings:


Temperature unit:
Celcius