
PMS5003
 PMS7003
 Датчик Plantower PMS 5003 и PMS 7003
PMS 7003 и PMS 5003 — это 7-е или 5-е поколение серии PMSx003, разработанной Plantower (китайское название 攀藤).
Настройка эксперимента
В этом эксперименте 3 PMS 7003 и 3 PMS 5003 расположены вместе. Цель состоит в том, чтобы понять точность показаний отдельных датчиков и потенциальный уровень ошибок, вызванных отсутствием эффективной калибровки недорогих датчиков.
Для каждого датчика (PMS5003 и PMS7003) имеется 3 датчика (обозначаемые как PMSx003 №1, №2 и №3), работающие попеременно в течение 3 минут. Каждую минуту собираются данные только за последние 30 секунд, а первые 30 секунд сохраняются, чтобы позволить датчику стабилизировать свои выходные данные.
Имеется дополнительный датчик PMS5003 (номер №4): это бывший в употреблении (старый) датчик, который несколько месяцев работал в непрерывном режиме на открытом воздухе. Цель этого датчика — понять, снижается ли точность с возрастом (по мере изнашивания лазера или вентилятора).
Спецификации: PMS5003.pdf and PMS7003.pdf.Обратите внимание, что данные PMSx от датчика поступают в двух вариантах: «标准颗粒物» (стандартные частицы или CF-1, байты 4–9) и «大气环境下» (атмосферная среда, байты 10). -15). Это второй, который мы используем для наших экспериментов (спасибо Барту за разъяснения).
Демонтаж датчика
Следующие фотографии сделаны с PMS5003, работавшего на открытом воздухе в течение нескольких месяцев в непрерывном режиме.
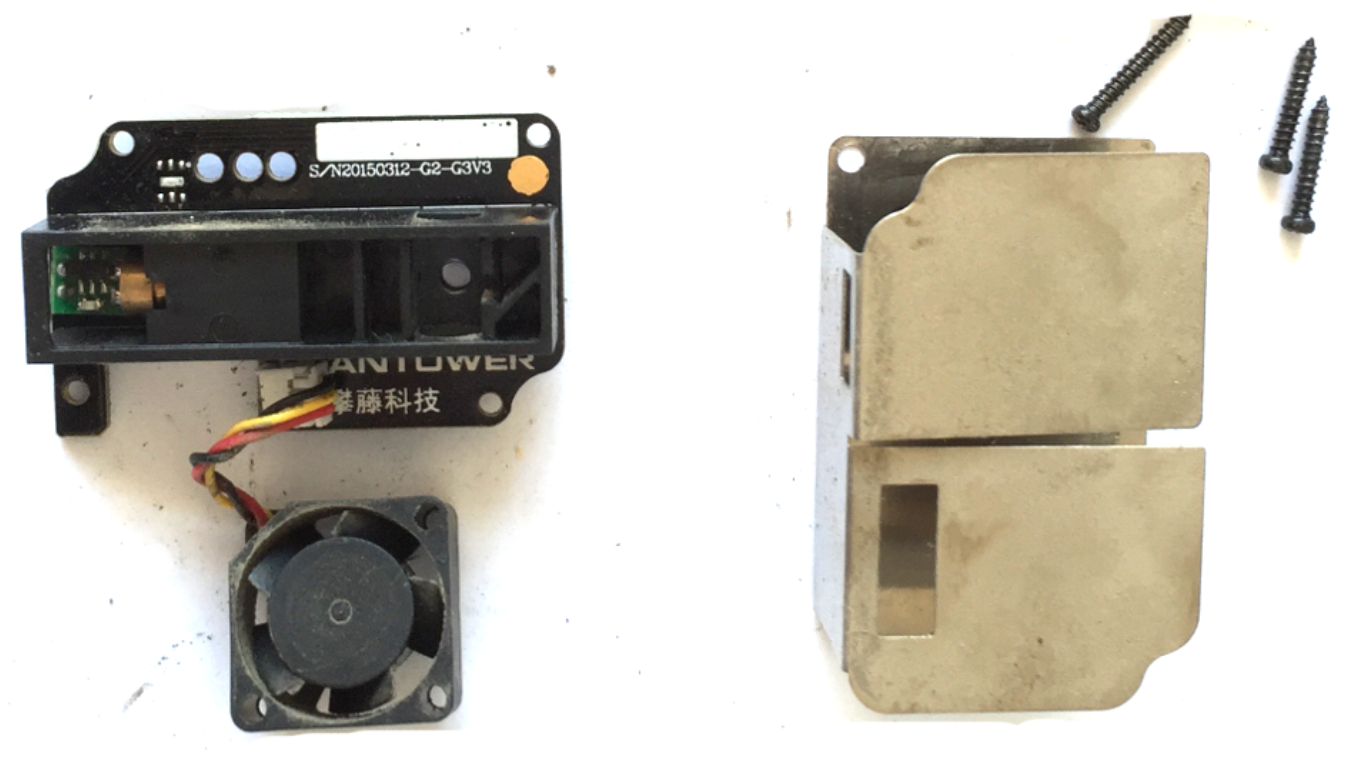

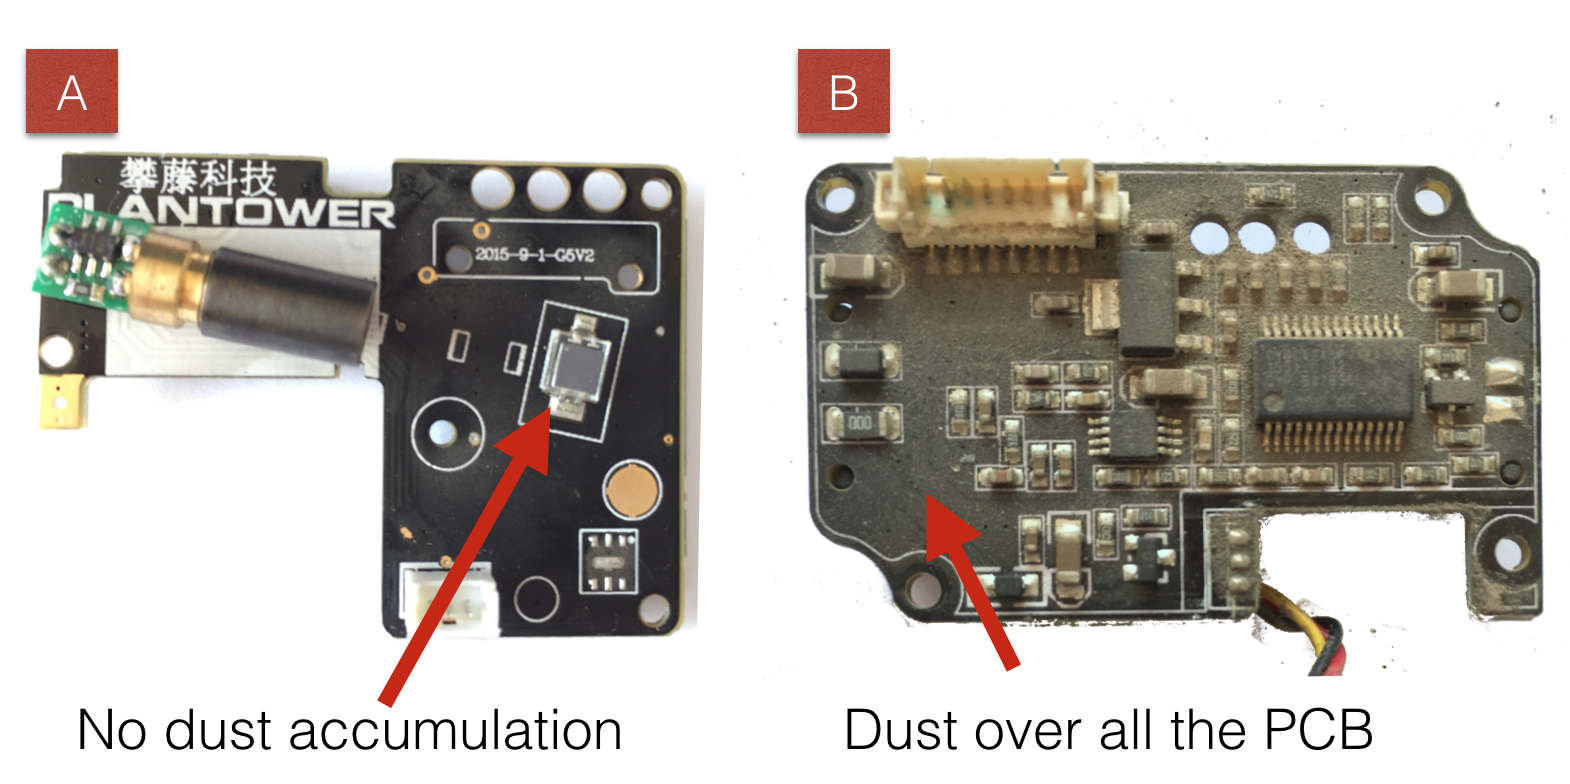
Хорошей новостью является то, что Plantower удалось создать довольно хорошую механическую конструкцию, которая предотвращает скопление пыли на передней стороне печатной платы (см. изображение A справа), где установлены лазер и диод. По сравнению с накоплением пыли на Dylos, это гарантирует гораздо лучший срок службы и точность данных. через некоторое время.
С точки зрения электрических и электронных компонентов PMS5003 не сильно отличается от первоначальной конструкции PMS1003. ЦП по-прежнему представляет собой Cypress CY8C4245, который представляет собой комбинированный процессор ARM Cortex-M0, работающий на частоте 48 МГц с выделенным АЦП. пример выходного сигнала диода.
Данные в реальном времени
db означает пылесборник и измеряется в единицах в минуту. Например, db2.5-um представляет количество частиц с аэродинамическим диаметром менее 2,5 мкм;
Временной ряд метеорологических условий
Метеорологические условия и особенно относительная влажность (RH) необходимы, поскольку высокая относительная влажность может иметь прямое влияние на размер частиц, обнаруживаемых лазером. Для датчиков BAM фактически требуется постоянная влажность.
График выше основан на данных станции CWOP EW2754. Таблица ниже основана на показаниях в реальном времени нашей станции GAIA A12.
Временной ряд твердых частиц
Обратите внимание, что первые три графика временных рядов показывают значения с использованием AQI (а не необработанных мг/м3). AQI основан на контрольных точках Агентства по охране окружающей среды США. Для PM1 используются точки останова PM2.5.
Для графиков твердых частиц показаны эталонные измерения BAM с соседних станций, но они не учитываются при построении графика отклонения. Целью этих экспериментов является понимание отклонения между датчиками одного и того же типа (например, PMS), а не между датчиками, использующими различные технологии (например, лазерный счетчик или бета-затухание).
Графики отклонений под каждым временным рядом рассчитываются как разница между минимумом (синим цветом) и соответственно. максимальное (красным) значение и среднее значение для каждого блока 5-минутного периода. Ось X показывает среднее значение, а ось Y — разницу между минимальным/максимальным и средним значением. Для первых трех графиков временных рядов разница выражается в AQI: таким образом легко оценить потенциальную ошибку в значении AQI этих недорогих датчиков.
Сравнение стандартных частиц (стандартных твердых частиц) и стандартной атмосферы (атмосферной среды)
The graphs below shows the correlation for the CF1 (X, absyss) and the ratio CF1/SAT (Y, ordinate), for the PM2.5 and PM10 data.
The almost too perfect correlation between approx. 30 mg to 100 mg for PM2.5 / PMS5003, (40mg to 150 for PM10) does not sound too scientific...
		cf1<30 ⇒ sat=cf1

			cf1>100 ⇒ sat = cf1 * 2/3


			cf1 in ∈ [30;100] ⇒ sat = 30 + cf1 * (cf1-30)/70 * 2/3
The formula has been updated with correct ratio (2/3)
Один интересный вопрос: является ли соотношение CF-1/SAT частью процесса калибровки, проводимого Plantower; По крайней мере, для PM2.5 верхний порог для PMS7003 и PMS5003 различен (85 для первого и 100 для второго). Когда будет доступно достаточно данных, эта страница будет обновлена ответом...
Корреляция между PM10 и PM2,5
На данный момент корреляция кажется совершенно линейной, но как только произойдет следующее событие загрязнения PM10, график сможет подтвердить эффективность определения размера контейнера.
Более того, есть одна интересная закономерность, которую стоит проверить, — это нелинейная кривая, которую можно увидеть на датчике Dylos. Эта кривая картина возникает из-за того, что датчик не может должным образом обнаружить различные бункеры для частиц, что вызвано слишком большим количеством частиц, «загораживающих» диод. На данный момент загрязнение воздуха слишком низкое, чтобы обнаружить это явление, но как только наступит зима, данные подтвердят существование этой закономерности или нет.
Временной ряд твердых частиц (установка в помещении)
--
