In April 2014, the Singapore NEA has updated the PSI calculation to also include PM2.5. http://www.nea.gov.sg/anti-pollution-radiation-protection/air-pollution-control/psi
مع تأثير الضباب الدخاني الأخير في جنوب شرق آسيا من إندونيسيا على سنغافورة والآن ماليزيا ، تلقينا العديد من الأسئلة حول سبب وجود اختلاف بين البيانات التي يمكن قراءتها من موقع NEA في سنغافورة ( nea.gov.sg ) ومشروع مؤشر جودة الهواء العالمي في سنغافورة صفحة على الإنترنت .
على سبيل المثال، إليك ما يمكن قراءته اليوم في موقع NEA:
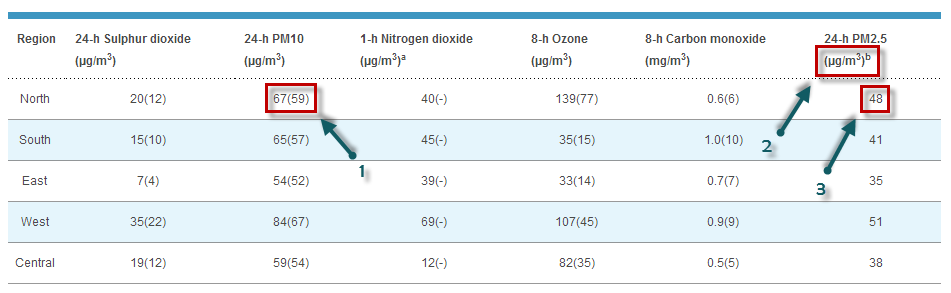
لسبب تاريخي، تستخدم سنغافورة مؤشر PSI ( مؤشر الملوثات القياسي ) لتقييم جودة الهواء. في الصورة أعلاه، الرقم 1 يتوافق مع قيمة PM10 المستخدمة لتقييم PSI. يمكن قراءة القيمة 67(/59) على أنها 67 ميكروجرام/م3، وهو ما يتوافق مع PSI قدره 59. يتم تقييم PSI على أنه الحد الأقصى لمؤشر PSI الفردي لكل من الملوثات: PM 10 , SO 2 , NO 2 , O 3 (الأوزون) وثاني أكسيد الكربون 2 .
PSI(Singapore-North) = max( PSIPM10-based, ... PSIO3-based )= max (59, ..., 77) = 77
ومع ذلك، فإن الشيء المثير للاهتمام هو أنه في هذا الجدول نفسه، يتم توفير بيانات PM2.5 أيضًا في العمود الأخير (انظر 3). يتم توفير هذه البيانات بوحدة ميكروجرام/م3 فقط (انظر 2)، ولا يوجد تحويل إلى شيء مثل PSI (أي تحويل من كتلة PM2.5 إلى مؤشر التلوث أو الجودة). ومع ذلك، فإن هذا التحويل موجود، ويتم تعريفه من قبل وكالة حماية البيئة الأمريكية . أسهل طريقة لإجراء التحويل هي استخدام الآلة الحاسبة عبر الإنترنت، المتوفرة على airnow.gov :
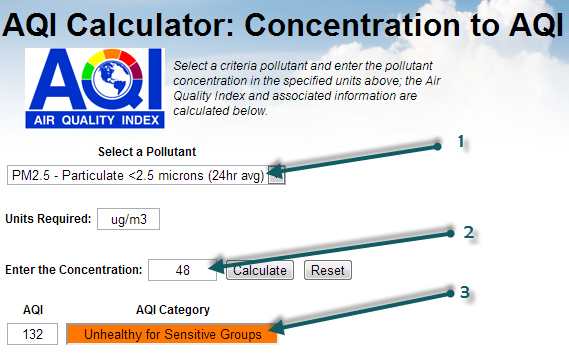
If you select the PM2.5 (1), then enter the mass concentration of 48 (2), can click on Calculate, you will obtain the AQI of 132 (3). So, based on the PM2.5 AQI conversion, the PSI that is used for Singapore could be extended (let's call it PSI++) to also take into account the PM2.5 information. In which case, the PSI++ would be the maximum of the regular PSI (based on PM10 only) and the PM2.5 AQI:
PSI++ = max( PSI, AQIPM.25 ) = max( 77, 132 ) = 132
This PSI++, that is commonly referred as AQI (or Air Quality Index), is what is being used on the the World Air Quality Index project, for all the cities (provided PM2.5 is available for the city). And this explains why the values are different between the NEA website and the World Air Quality Index project.
Moreover, when doing the convertion, make sure you use the 1-hour reading for the PM2.5 concentration rather than the 24-hours averaged value, as shown on the below image:
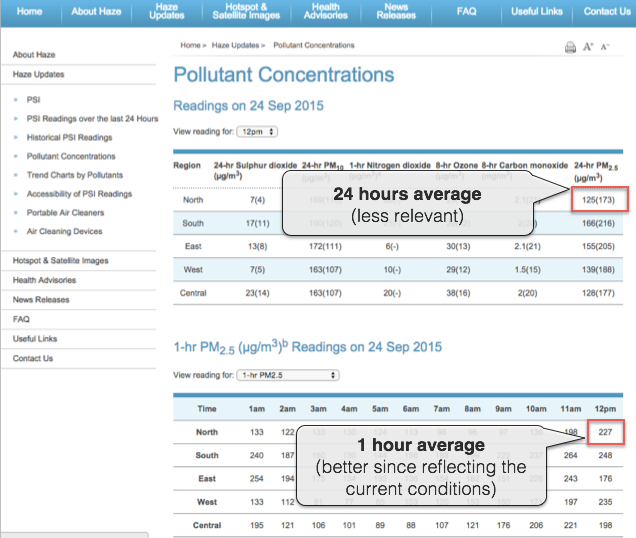
http://www.haze.gov.sg/haze-updates/pollutant-concentrations/type/PM25-1Hr
If you want to know more about PM10 vs PM2.5, and especially why PM10 is still used, please check the faq entry about why is PM2.5 often higher than PM10? Is PM10 still a relevant measure?
--
For more information about specific countries or continent, please refer to those articles: Thailand and Malysia - India - China - Hong Kong / Canada (Air Quality Health Index) - South America - Australia - Quebec and Montreal - Singapore - Poland - Indonesia .
For information about the 24 hours averaging used or Ozone and Particulate Matter (PM2.5), please refer to those two articles: Ground Ozone Index - PM2.5 Instant Cast
