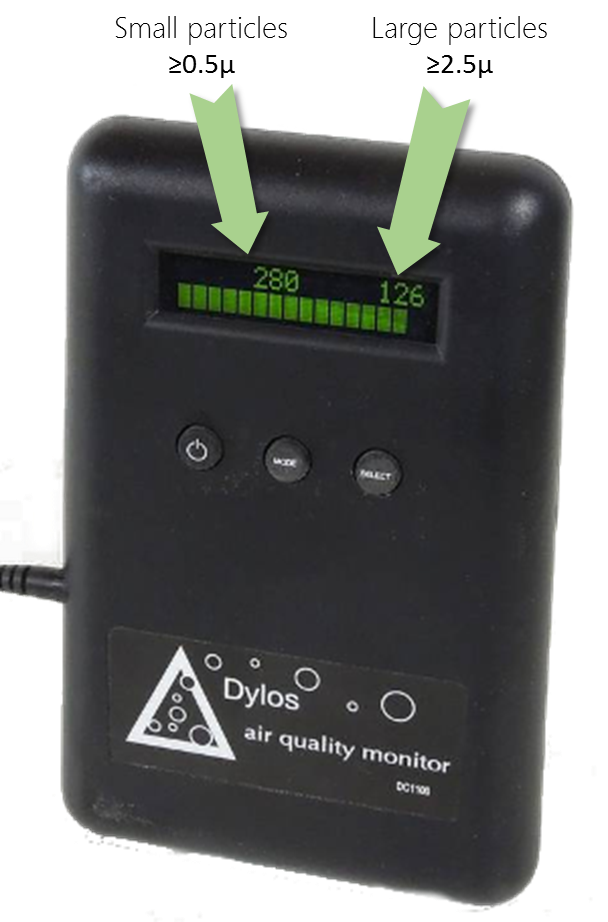
The Dylos air quality monitor comes in several version: Standard and Pro: Quoted from Dylos's website, it says that " the DC1100 Pro has all the features of the standard DC1100 but with increased lower sensitivity - detecting particles down to 0.5 micron (0.5µ). The large particle size range is calibrated to 2.5 microns (2.5µ) and above".
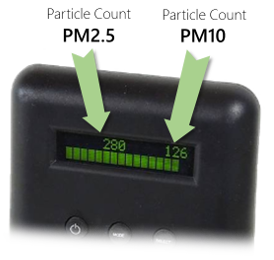
Interestingly, the most common sizes in the Air Quality industry is 2.5 µ (refered as PM2.5) and 10 µ (refered PM10). In this case, does it really make sense for the Dylos pro to measure particules as small as 0.5 µ? Shouldn't instead measure 2.5µ and 10µ particules? Actually, maybe this 0.5 µ? claim is more a marketing argument rather than a technology argumenet, since, from the empirical data, what it measures is closer to 2.5 µ and 10 µ rather than 0.5 µ and 2.5 µ! Here is the explanation why:
--
On Thursday, April 10th 2014, in the morning, the Air in Beijing was very special: It is one of those rare days where the PM10 was the dominant pollutant, reaching up to 601 µm/m3 at noon time, which is equivalant to an AQI of 497 (at 24 hours exposure). At the same time, the trend for PM2.5 was going downward, i.e improving from 130 to 70 µm/m3 (equivalant to an AQI down from 189 to 158).
Usually (empirally verified), the dominent pollutant is the PM2.5 particules, and not PM10. Therefore, that special day, in order to ensure that this higher PM10 readings were not caused by defective equipment, we checked the Dylos readings to confirm the trend. This is what you can see from those two graphs. The zone highligted in orange is Thursday 10th, from midnight to noon. The graph on the right is plotting both BAM (in blue) PM2.5 readings (in µg/m3) and Dylos (in red) ≥0.5µ particule count, while the one on the left is for the BAM PM10 and Dylos ≥2.5µ.
Comparative analysis of Beijing Chaoyang Agricultural Exhibition Hall (朝阳农展馆) BAM monitoring stations and Beijing Sanlitun Dylos monitoring station (more info about the setup.) | |
If the Dylos monitoring claim to detect particules down to 2.5 µ for the large particule readings, then it should be expected that this large particules reading follow the PM2.5 trend. But this is not the case. Clearly, from the graph, the Dylos readings for large particules are following the PM10 trend while readings for small particule are following the PM2.5 trend. That clearly indicates that what the Dylos monitoring is detecting is closer to 2.5 µ and 10 µ rather than what they claim to be 0.5 µ and 2.5 µ.
To further prove the point, the multidimensional correlation graph for all 4 readings is provided below. The color code used for the plot is orange for the Thursday morning readings, and blue for the other readings. The pairs "BAM PM10" and "Dylos >2.5" as well "BAM PM2.5" and "Dylos >0.5" is obviously showing a very good linear correlation, while the pair "BAM PM2.5" and "Dylos >2.5" is showing diversion, i.e. non linearity, especially for the given Thursday.
--
The conclusion for the above analysis is clear and straight forward: The claim from Dylos to detect particles down to 0.5 µ is more of a marketing argument than a technology fact. From the above data, there is no doubt that the Dylos monitor readings are closer to detect size of 2.5µ and 10µ rather than 0.5µ and 2.5µ. And, actually, this is even better like this, since those are the sizes that are used for Air Quality Standard!
The next important question is how to convert the Dylos readings into the AQI standard. This will be presented in our next experiment.
--

