데이터 업로드 API 및 샘플 스크립트

첫 번째 단계는 data-platform 페이지에서 토큰을 얻는 것입니다.

자신만의 토큰이 있으면 다음 스크립트를 사용하여 데이터를 업로드할 수 있습니다. 첫 번째 스테이션 데이터를 업로드한 후 aqicn.org/data-feed/verification/으로 이동하여 스테이션을 구성하고 업로드된 데이터를 확인하세요.

지원되는 소프트웨어 플랫폼:

우리는 다음 3가지 플랫폼에 바로 사용할 수 있는 소프트웨어를 제공합니다.

  • Arduino: Arduino CPU가 있는 경우 github.com(aqicn/gaia-a08-arduino.
  • Python: 아래 코드 스니펫 사용
  • 명령줄(CURL): 아래 코드 스니펫 사용

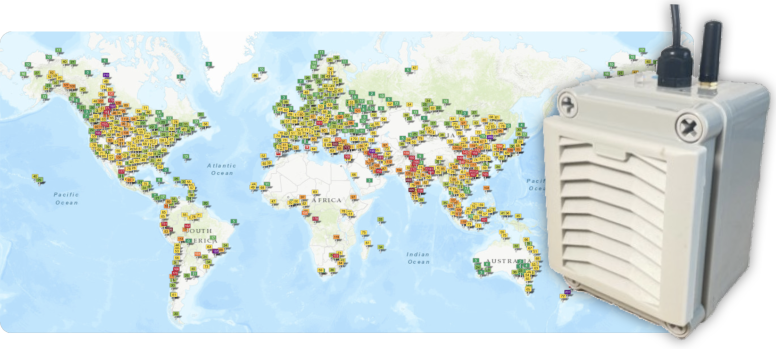
모니터링 스테이션이 없고 하나 구입하고 싶다면 GAIA 대기 질 모니터링 스테이션을 확인하세요.

DIY 스테이션을 선호한다면 GAIA A08을 확인하세요.

작동 모드

데이터를 업로드할 때는 최근 1분 동안의 데이터(일반적으로 오염물질당 약 60개의 샘플)의 평균값을 계산하여 매분마다 서버로 전송하는 것이 좋습니다.

데이터 업로드 방법을 잘 모르시거나 사용자 지정 스크립트를 사용하고 싶으시면 아래 양식을 통해 메시지를 보내주세요. 최선을 다해 도와드리겠습니다.


- -

샘플 코드(파이썬)

import requests  
 
# Sensor parameter   
sensorReadings = [   
	{'specie':'pm25', 'value': 393.3},  
	{'specie':'pm10', 'value': 109.3}  
] 
 
# Station parameter   
station = { 
	'id':		"station-001",  
	'location':  { 
		'latitude': 28.7501,  
		'longitude': 77.1177 
	} 
} 
 
# User parameter - get yours from https://aqicn.org/data-platform/token/ 
userToken = "dummy-token-for-test-purpose-only" 
 
# Then Upload the data  
params = {'station':station,'readings':sensorReadings,'token':userToken}  
request = requests.post( url = "https://aqicn.org/sensor/upload/",  json = params) 
#print(request.text) 
data = request.json()  
 
if data["status"]!="ok": 
	print("Something went wrong: %s" % data) 
else: 
	print("Data successfully posted: %s"%data) 

샘플 코드(컬)

curl -X POST https://aqicn.org/sensor/upload -H 'Content-Type: application/json' --data '{\ 
"token": "dummy-token-for-test-purpose-only",\ 
"station": { "id": "station-001" },\ 
"readings": [{"specie":"pm2.5", "value": 393.3}]\ 
}'

샘플 코드(아두이노)

Check github.com/aqicn/gaia-a08-arduino for the full code.
#include <WiFi.h> 
#include <HTTPClient.h> 
#include <ArduinoJson.h> 
 
#define LATITUDE 28.7501 
#define LONGITUDE 77.1177 
 
void upload(float pm25_concentration, float pm10_concentration, const char * token) 
{ 
 
    static char stationID[32]; 
    uint64_t efuseMac = ESP.getEfuseMac(); 
    uint16_t chip = (uint16_t)(efuseMac >> 32); 
    snprintf(stationID, 32, "station-%x", chip); 
 
    doc["token"] = token; 
    doc["station"]["id"] = stationID; 
 
    doc["station"]["location"]["latitude"] = LATITUDE; 
    doc["station"]["location"]["longitude"] = LONGITUDE; 
 
    doc["readings"][0]["specie"] = "pm25"; 
    doc["readings"][0]["value"] = pm25_concentration; 
    doc["readings"][0]["unit"] = "µg/m3"; 
 
    doc["readings"][1]["specie"] = "pm10"; 
    doc["readings"][1]["value"] = pm10_concentration; 
    doc["readings"][1]["unit"] = "µg/m3"; 
 
    static char json_body[1024]; 
    serializeJson(doc, json_body); 
 
    HTTPClient http; 
    http.begin("https://aqicn.org/sensor/upload"); 
    http.addHeader("Content-Type", "application/json"); 
    int httpResponseCode = http.POST(json_body); 
 
    if (httpResponseCode > 0) 
    { 
 
        String response = http.getString(); 
        Serial.println(httpResponseCode); 
        Serial.println(response); 
    } 
    else 
    { 
 
        Serial.print("Error on sending POST: "); 
        Serial.println(httpResponseCode); 
    } 
 
    http.end(); 
}

API 옵션

Parameter Type Optional/Mandatory Explanations
token string mandatory

aqicn.org/data-platform/token에서 자신만의 토큰을 받으세요.

station
station.id string mandatory

고유한 스테이션 ID - 최대 128자의 이름을 선택할 수 있습니다.
이 이름은 내부적으로만 사용됩니다. 다른 사람은 이 ID를 볼 수 없습니다.

station.name string optional

관측소 이름 - 예를 들어 건물 이름, 거리 이름, 대학 학과 이름, 개인 기상 관측소 코드 등이 될 수 있습니다.
이 이름은 방송국 URL의 접미사로 사용됩니다.

station.location.latitude float optional

관측소의 경도

station.location.longitude float optional

관측소의 경도

organization
org.website string optional

귀하의 관측소/센서에 대한 자세한 정보가 있는 웹사이트가 있는 경우 귀하의 관측소를 볼 때 지도에 이 링크를 추가할 것입니다.

org.name string optional

웹사이트를 지정하면 이 "조직 이름"이 웹사이트에 연결됩니다.

readings
readings[*].specie string mandatory

보고하는 오염물질의 이름입니다. 가스 센서의 경우 다음을 사용하십시오: "pm2.5", "pm10", "pm1.0", ... 가스 센서의 경우 다음을 사용하십시오: "co2", "no2", "o3", ... 날씨 센서의 경우, 사용: "온도", "습도", "압력", "풍속", "돌풍", "풍향", ..
실제로 원하는 종 이름을 사용할 수 있습니다. 스테이션이 확인되면 이름이 시스템에서 정규화됩니다.

readings[*].value float mandatory

센서가 매초마다 값을 생성하고 매분만 업로드하는 경우 이 값은 지난 1분 동안 읽은 모든 값의 평균이어야 합니다.

readings[*].unit string optional

값의 단위입니다. 예를 들어 먼지 센서의 경우 "mg/m3", 가스 센서의 경우 ppb, 온도 센서의 경우 C입니다.

readings[*].time string optional

ISO 8601 형식의 판독 날짜 및 시간

readings[*].min float optional

판독값이 여러 값의 평균을 기반으로 하는 경우 이는 평균화에 사용되는 모든 값의 최소값에 해당합니다.

readings[*].max float optional

판독값이 여러 값의 평균을 기반으로 하는 경우 이는 평균에 사용되는 모든 값의 최대값에 해당합니다.

readings[*].median float optional

판독 값이 여러 값의 평균을 기반으로 하는 경우 이는 평균에 사용되는 모든 값의 중앙값에 해당합니다.

readings[*].stddev float optional

판독 값이 여러 값의 평균을 기반으로 하는 경우 이는 평균에 사용되는 모든 값의 표준 편차에 해당합니다.

readings[*].averaging float optional

위의 값이 여러 값의 평균을 기반으로 하는 경우 이는 평균 기간의 지속 시간(초)에 해당합니다.
예를 들어 분 평균 데이터에는 60을 사용하고 시간당 평균 데이터에는 3600을 사용합니다.

실시예 1

{ 
	"token": "......", 
	"station": { 
		"id": "station-001", 
		"name": "HCPA Santa Cecília", 
		"location": { 
			"latitude": 103.37893, 
			"longitude": 43.17108, 
		} 
	}, 
	"org": { 
		"website":"https://pacto.upsensor.com/", 
		"name":"Porto Ar Alegre", 
	}, 
	"readings": [ 
		{"time":"2026-09-11T19:56:06+09:00","specie":"pm2.5", "value": 393.3, "unit":"mg/m3", "min":390.3, "max": 402.3, "stddev": 0.332},  
		{"time":"2026-09-11T19:56:06+09:00","specie":"pm10", "value": 109.3, "unit":"mg/m3"}, 
		{"time":"2026-09-11T19:56:06+09:00","specie":"co2", "value": 459.3, "unit":"ppb"}, 
		{"time":"2026-09-11T19:56:06+09:00","specie":"temp", "value": 26.8, "unit":"C"}, 
	] 
}

실시예 2

{ 
	"token": "......", 
	"station": { 
		"id": "station-001", 
	}, 
	"readings": [ 
		{"specie":"pm2.5", "value": 393.3} 
	] 
}

완전한 코드 예

SDS 센서에서 지속적으로 읽고 매분 업로드하는 데 이 코드를 사용할 수 있습니다. (스크립트는 https://github에서도 사용 가능) .com/aqicn/sds-sensor-reader).

import requests 
import random 
import time 
import math 
import json 
import sys 
from serial import Serial 
 
LOCATION = {'latitude': 28.7501, 'longitude': 77.1177} 
TOKEN    = "dummy-token-for-test-purpose-only" 
SENSORID = "station-001" 
USBPORT  = "/dev/ttyUSB0" 
 
class SensorDataUploader: 
 
    def __init__(self, station, token): 
        self.token = token 
        self.station = station 
 
 
    def send(self,readings): 
 
        params = {'station':self.station,'readings':readings,'token':self.token}  
        print("Uploading: %s"%json.dumps(params, indent=4)) 
 
        request = requests.post( url = "https://aqicn.org/sensor/upload/",  json = params) 
        data = request.json()  
        if data["status"]!="ok": 
            print("Something went wrong: %s" % data) 
        else: 
            print("Data successfully posted: %s"%data) 


class Accumulator: 
 
    def __init__(self, name): 
        self.name = name 
        self.values = [] 
 
    def add(self,val): 
        self.values.append(val) 
 
    def count(self): 
        return len(self.values) 
 
    def reset(self): 
        self.values=[] 
 
    def min(self): 
        return self.values[0] 
 
    def max(self): 
        return self.values[len(self.values)-1] 
 
    def median(self): 
        return self.values[len(self.values)/2] 
 
    def mean(self): 
        return float(sum(self.values)) / len(self.values) 
 
    def stddev(self): 
        l = len(self.values) 
        mean = self.mean() 
        return math.sqrt(float(reduce(lambda x, y: x + y, map(lambda x: (x - mean) ** 2, self.values))) / l) 
 
 
    def summary(self): 
        self.values.sort() 
        return {"specie":self.name,'value':self.mean(),'min':self.min(),'max':self.max(),'median':self.median(), 'stddev':self.stddev()}  


class DummyReader: 
 
    def read( self ): 
 
        time.sleep(1.1) 
        return {"pm2.5":random.random()*10,"pm10":random.random()*10} 
 
 
class SDS011Reader: 
 
    def __init__(self, inport): 
        self.serial = Serial(port=inport,baudrate=9600) 
        self.values = [] 
        self.step = 0 
 
    def read( self ): 
 
        # time.sleep(1) 
        # return {"pm2.5":random.random()*100,"pm10":random.random()*100} 
 
        while self.serial.inWaiting()!=0: 
            v=ord(self.serial.read()) 
 
            if self.step ==0: 
                if v==170: 
                    self.step=1 
 
            elif self.step==1: 
                if v==192: 
                    self.values = [0,0,0,0,0,0,0] 
                    self.step=2 
                else: 
                    self.step=0 
 
            elif self.step>8: 
                self.step =0 
                pm25 = (self.values[0]+self.values[1]*256)/10 
                pm10 = (self.values[2]+self.values[3]*256)/10 
                return {"pm2.5":pm25,"pm10":pm10} 
 
            elif self.step>=2: 
                self.values[self.step-2]=v 
                self.step= self.step+1 
 
        return None 


def readAndUpload(sensor, uploader): 
 
    try: 
 
        while True: 
            accumulators = {} 
            startTime = time.time() 
 
            while time.time() < startTime+60: 
                values = sensor.read() 
                if values==None: 
                    continue 
 
                print("Reading [%2d]: %s"%(int(time.time()-startTime),values)) 
                for specie, value in values.items(): 
                    if not (specie in accumulators): 
                        accumulators[specie]=Accumulator(specie) 
                    accumulators[specie].add(value) 
 
 
            readings = [] 
            for specie, accumulator in accumulators.items(): 
                readings.append(accumulator.summary()) 
 
            if len(readings)>0: 
                uploader.send(readings) 
            else: 
                print("No value read from the sensor...") 
 
 
    except KeyboardInterrupt: 
        print "Bye" 
        sys.exit() 


print("Starting reading sensor "+SENSORID+" on port "+USBPORT) 
 
# Station parameter   
station = {'id':SENSORID, 'location':LOCATION} 
uploader = SensorDataUploader(station, TOKEN) 
 
sensor = SDS011Reader(USBPORT) 
# sensor = DummyReader() 
readAndUpload(sensor,uploader) 
 

Do you know of any Air Quality stations in your area?
why not participate to the map with your own air quality station?

GAIA 공기질 모니터는 설정이 매우 쉽습니다. WIFI 액세스 포인트와 USB 호환 전원 공급 장치만 있으면 됩니다.

일단 연결되면 지도와 API를 통해 실시간 대기 오염 수준을 즉시 확인할 수 있습니다.

스테이션에는 10m 방수 전원 케이블, USB 전원 공급 장치, 장착 장비 및 옵션 태양광 패널이 함께 제공됩니다.

대기질 및 환경 오염 측정에 관하여 :

대기질 지수 단계에 대하여

AQI지수구분구간의미
0 - 50좋음대기오염 관련 질환자군에서도 영향이 유발되지 않을 수준
51 -100보통환자군에게 만성 노출시 경미한 영향이 유발될 수 있는 수준
101-150민감군영향환자군 및 민감군에게 유해한 영향이 유발될 수 있는 수준
151-200나쁨환자군 및 민감군(어린이, 노약자 등)에게 유해한 영향 유발, 일반인도 건강상 불쾌감을 경험할 수 있는 수준
201-300매우나쁨환자군 및 민감군에게 급성 노출시 심각한 영향 유발, 일반인도 약한 영향이 유발될 수 있는 수준
300+위험환자군 및 민감군에게 응급 조치가 발생되거나, 일반인에게 유해한 영향이 유발될 수 있는 수준
(Reference: see airkorea.or.kr)

대기질과 오염에 대해 더 많은 것을 알아보려면 위키피디아의 대기질 문서(영어)을 보거나 대기질과 건강에 대한 AirNow 가이드(영어)를 참조해보세요.

매우 유용한 베이징의 의학박사 Richard Saint Cyr MD의 건강 관련 팁을 보려면 www.myhealthbeijing.com 의 블로그를 확인하세요.


사용안내: 모든 대기 질 데이터는 발행 당시에 검증되지 않았으며, 품질 보증으로 인해 이러한 데이터는 예고없이 언제든지 수정 될 수 있습니다. 세계 대기 품질 지수 프로젝트는이 정보의 내용을 편집함에있어 합당한 기술과 관심을 행사했으며 어떤 상황에서도 세계 대기 품질 지수 (World Air Quality Index) 프로젝트 팀 또는 그 대리인은이 데이터의 공급으로 인해 직접 또는 간접적으로 발생하는 손실, 상해 또는 손해에 대해 계약, 불법 행위 또는 기타의 책임을지지 않습니다.