Publishing Air Quality Data
on the aqicn.org / waqi.info map

Share: aqicn.org/data-feed/kr/


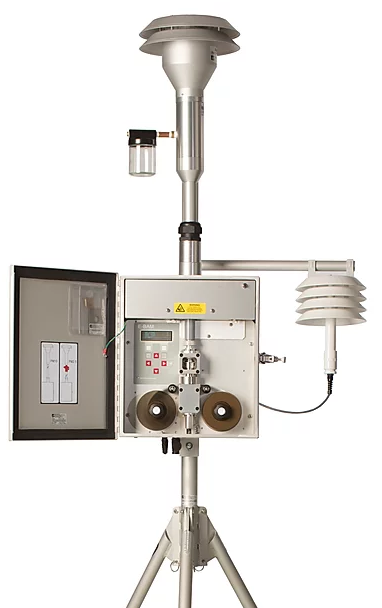
MetOne BAM 1020 station


Luft-Daten DIY station
Publishing data on the World Air Quality Index world map is simple. Both professional and DIY air quality monitoring stations are accepted:
  • Professional stations operated by EPAs are qualified by default, and are given dedicated pages (such as map/montenegro or city/paris) as well as historical data pages (eg historical/kosovo).

  • For the DIY stations (such as luft-daten), additional quality control is required before publishing on the map. This is to ensure high quality data accross the map (more explanation here).

There are two cases in order to upload your data into the map:
    Either you already have a website (or a feed such as thingspeak) from which we can collect the data from your stations. In this case our system will periodically load your page, extract the data and then republish it on our map. Check the feed examples for website examples.

    Either you do not have a website, but you have a station, and you would like to "push" the data directly to our system. In this case, you will need to write a small programm to "post" your station data via our upload API. Code sample is available from the upload API page.

If you fall in the first category (have a website), or if you have any doubts, send us a message using the form below. If you fall in the second category, and want to programatically post the data via our upload API, check our data upload scripts and API page.

Contact Form

Data Feed - Inquiry form
Enter your name - eg "John Doe"
Enter your email address - eg "john.doe@mail.com"
Enter your country or city - eg Tbilisi, Georgia
Enter your data-feed URL - eg "https://airnow.gov/"
Write few words about your request - eg: "A feed for Tbilisi, Georgia is available at ..", "The feed for Sofia, Bulgaria has been updated", "I need help to setup the feed for Dakar, Senegal", "The location of the station Patumahoe in Auckland is incorrect. It's lat,lon is -37.204,174.864", ..


나만의 공기 품질 모니터링 스테이션을 원하십니까?

GAIA 대기 모니터링 센터는 첨단 레이저 입자 센서를 사용하여 가장 유해한 대기 오염 물질 중 하나 인 PM2.5 오염 물질을 실시간으로 측정합니다.

설치가 매우 쉽고 WIFI 액세스 포인트와 USB 전원 공급 장치 만 있으면됩니다. 일단 연결되면 대기 오염 수준은 실시간으로 실시간으로보고됩니다.

대기질 및 환경 오염 측정에 관하여 :

대기질 지수 단계에 대하여

AQI지수구분구간의미
0 - 50 좋음 대기오염 관련 질환자군에서도 영향이 유발되지 않을 수준
51 -100 보통 환자군에게 만성 노출시 경미한 영향이 유발될 수 있는 수준
101-150 민감군영향 환자군 및 민감군에게 유해한 영향이 유발될 수 있는 수준
151-200 나쁨 환자군 및 민감군(어린이, 노약자 등)에게 유해한 영향 유발, 일반인도 건강상 불쾌감을 경험할 수 있는 수준
201-300 매우나쁨 환자군 및 민감군에게 급성 노출시 심각한 영향 유발, 일반인도 약한 영향이 유발될 수 있는 수준
300+ 위험 환자군 및 민감군에게 응급 조치가 발생되거나, 일반인에게 유해한 영향이 유발될 수 있는 수준
(Reference: see airkorea.or.kr)

대기질과 오염에 대해 더 많은 것을 알아보려면 위키피디아의 대기질 문서(영어)을 보거나 대기질과 건강에 대한 AirNow 가이드(영어)를 참조해보세요.

매우 유용한 베이징의 의학박사 Richard Saint Cyr MD의 건강 관련 팁을 보려면 www.myhealthbeijing.com 의 블로그를 확인하세요.


사용안내: 모든 대기 질 데이터는 발행 당시에 검증되지 않았으며, 품질 보증으로 인해 이러한 데이터는 예고없이 언제든지 수정 될 수 있습니다. 세계 대기 품질 지수 프로젝트는이 정보의 내용을 편집함에있어 합당한 기술과 관심을 행사했으며 어떤 상황에서도 세계 대기 품질 지수 (World Air Quality Index) 프로젝트 팀 또는 그 대리인은이 데이터의 공급으로 인해 직접 또는 간접적으로 발생하는 손실, 상해 또는 손해에 대해 계약, 불법 행위 또는 기타의 책임을지지 않습니다.


설정


언어 설정 :


Temperature unit:
Celcius