The Shinyei experiment
Real-time Air Quality readings from Beijing

падзяліцца: aqicn.org/sensor/shinyei/be/
For a complete list of all the Air Quality Sensors test on the World Air Quality Index project, check our sensor overview page.

Introduction

For more information about those real-time dylos and BAM monitor PM2.5 and PM10 readings, please refer to our article on the Dylos Air Particule Counter experimentation.


If you want to know about other affordarable Air Quality Sensors such as Shinyei and Samyoung, check our sensor overview page.

Are cheap low-cost air quality sensor really worth?

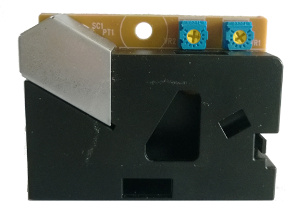
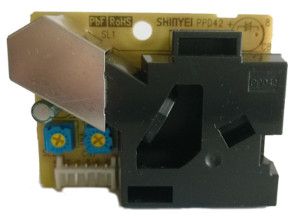
There are many affordable and low-cost air particule sensor. The most famous one is definitely the Japanese Shinyei sensor, with a cost of around 75 CNY (12 USD), and it's Korean copy, the Samyoung sensor, with a cost of around 35 CNY (5.5 USD).

This objective of this experiement is to provide empiral data about the quality of those sensor, e.g. can they be used to acurately measure Air Quality, especially for outdoor data and polluted countries.

There are many research papers on this topic. The one most up-to-date at the time of writing is from David Holstius. Check it online here: field calibrations of a low cost aerosol sensor ( research paper).

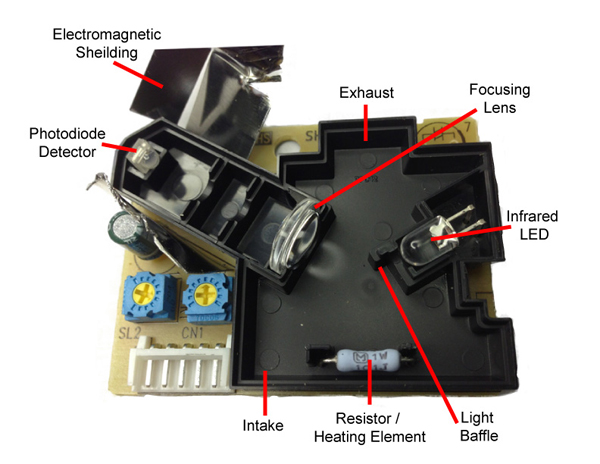
Inside the low-cost sensor

Compared to the Dylos monitor, one could say that low-cost sensors are more like measuring the air opacity rather than individual particles:

The Dylos monitor works by counting individual particles, and classifying them by size (smaller than 0.5 and smaller than 2.5). By doing so, it is able to provide accurate values about the exact amount of dust particles in the air. And by knowing the typical "dust" type that is being measured, is it somewhat straight forward to deduct the total mass of particles.

The low-cost sensor, on the contrary, are not counting individual particles, but instead, counting the amount of time particles are detected by the photo diode sensor. The graph below represents how the Shinyei is "calculating" the air quality: First, it applies a pass band filter to remove very small particles or noise, which is represented by the red line. Then, independently of the intensity (or particle size), it counts the amount of time any particle is seen. This amount of time, also called "Low Pulse Occupancy" (LPO), can be considered as the "opacity percentage" of the air circulating through the sensor. In order to measure the LPO for different particles sizes, the sensor provide a variable input which allows to adjust the pass-band filter.
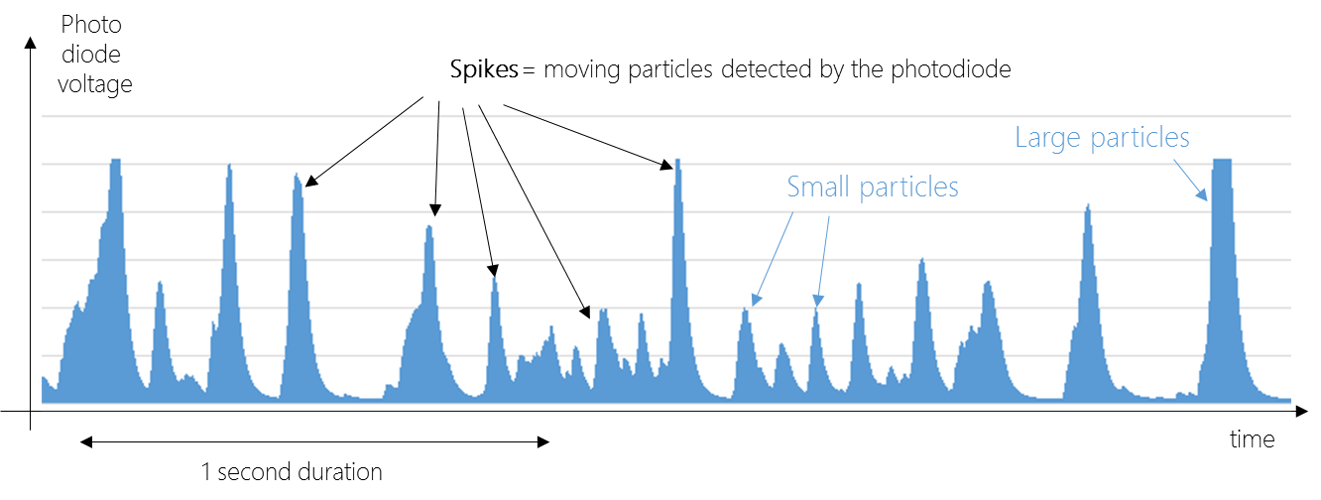
Shinyei PPD42NS raw diode reading
Shinyei PPD42NS raw diode reading (in volts)
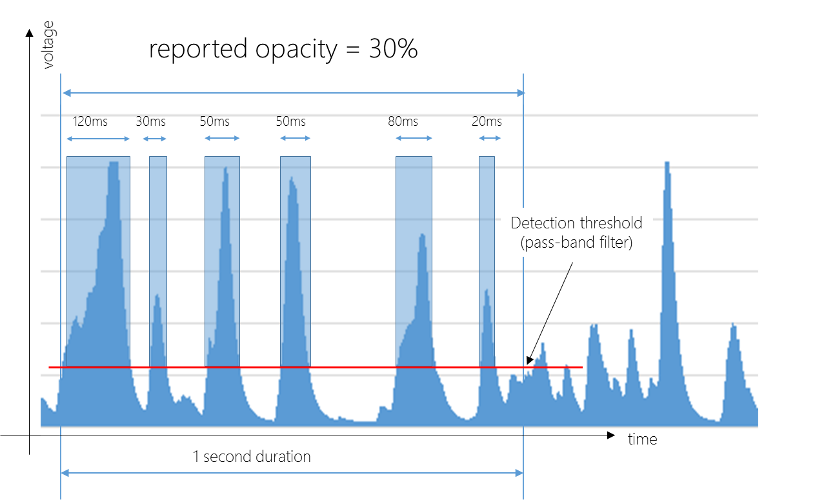
Shinyei PPD42NS raw LPO reading
Shinyei PPD42NS raw LPO reading (in occupancy)

Experiment Setup


The low-cost particule counters used is this experiment are based on: The reference air quality meters are:
For the source code and hardware connectivity information, please refer to this page: aqicn.org/api/shinyei/.

Note (December 18th 2014): Due to a wrong setup, the data is from the Samyoung is currently not available - it will added again later. Also, this experiment has been updated to use both Shinyei output, which are supposed to be able to reflect small and large particles.

Real-time data

Current Dylos readings are: Particules larger than 2.5 is -, larger than 0.5 is -, updated on - - (China time).

Current Shinyei readings are: LPO for particules larger than 1 is -, LPO for 2.5 is -, updated on - - (China time).

Time series graphs

From the previous graph (Shinyei vs. Samyoung), it is clear that the data generated by the Samyoung sensor is not at all reflecting actual air quality. In order to ensure that this issue is not caused by a deficient sensor, the sensor was replaced with a new one, but yet, no improvement were observed. For this reason, the Samyoung data will not be represented in the next plots. It is however interresting to notice that other resarch papers, such as the low-cost coarse airborne particulate matter sensing for indoor occupancy detection study (online ref) shows much better results for the Samyoung sensor, so this this something to be further investigated.

- -

Shinyei:
PM2.5 based Air quality data:
PM10 based Air quality data:

Initial findings

At first glance, the correlation for the Shinyei sensor seems to be much stronger from PM10 than PM2.5 readings. But, actually, it seems to be even more complicated since during some periods, the correlation to PM10 seems higher while for other periods, correlation to PM2.5 is higher. If this turns out to be true (which will require more data for the confirmation), that would mean that calculating the AQI from a Shinyei sensor could prove to be very arbitratary (see the PM10 vs. PM2.5 analysis).


- -

For the list of all air quality sensors, check the Sensor Overview page

Read or publish comments (they rely on Disqus)
Пра якасць паветра і вымярэнне забруджвання:

Пра ўзровень якасці паветра

- Значэнні індэкса якасці паветра (AQI).Узроўні занепакоенасці здароўем
0 - 50 добра Якасць паветра лічыцца здавальняючым, і забруджванне паветра ўяўляе мала або няма рызыкі
51 -100 ўмераны Якасць паветра з'яўляецца прымальным; Аднак, для некаторых забруджвальных рэчываў можа быць умераным турботай здароўя для вельмі невялікай колькасці людзей, якія незвычайна адчувальныя да забруджвання паветра.
101-150 Нездаровы для адчувальных груп Члены адчувальных груп могуць адчуваць наступствы для здароўя. Шырокая грамадскасць, хутчэй за ўсё, будуць закрануты няма.
151-200 нездаровы Кожны можа пачаць адчуваць ўздзеянне на здароўе; Члены адчувальных груп могуць адчуваць больш сур'ёзныя наступствы для здароўя
201-300 Вельмі Нездаровы папярэджання для здароўя надзвычайных сітуацый. Усё насельніцтва, хутчэй за ўсё, будуць закрануты.
300+ небяспечны Небяспечна для здароўя: кожны можа адчуваць больш сур'ёзныя наступствы для здароўя

Каб даведацца больш пра якасць паветра і забруджванне, азнаёмцеся з тэмай Вікіпедыі «Якасць паветра» або кіраўніцтвам airnow «Якасць паветра і ваша здароўе» .

Вельмі карысныя парады па здароўі ад доктара медыцынскіх навук з Пекіна Рычарда Сэн-Сіра глядзіце ў блогу www.myhealthbeijing.com .


Апавяшчэнне аб выкарыстанні: Усе дадзеныя па якасці паветра з'яўляюцца неправеранымі на момант публікацыі, і ў сувязі з забеспячэннем якасці гэтых дадзеныя могуць быць зменены без папярэдняга паведамлення ў любы час. World Air Індэкс якасці Праект ажыццяўляецца ўсе разумныя навыкі і сыход пры складанні зместу гэтай інфармацыі і ні пры якіх абставінах не World Air Індэкс якасці каманда праекта або яго агенты нясуць адказнасць у кантракце, деликта ці іншым чынам за любыя страты, пашкоджанні або шкоду, прама ці ўскосна ад крыніцы гэтых дадзеных.


Settings


Language Settings:


Temperature unit:
Celcius