Forschung zu Luftqualitätsüberwachungsgeräten und Sensoren

Die Überwachung der Luftqualität ist eine bekannte und etablierte Wissenschaft, die bereits in den 80er Jahren begann. Damals war die Technologie noch recht begrenzt und die Lösung zur Quantifizierung der Luftverschmutzung komplex, umständlich und sehr teuer.
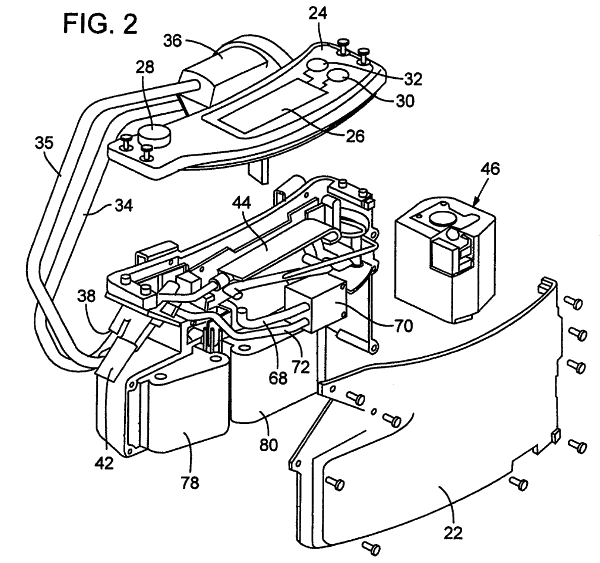 Patent US7947503: Monitor and methods for characterizing airborne particulates
 Glücklicherweise werden die Lösungen zur Luftqualitätsüberwachung heutzutage dank der neuesten und modernsten Technologien nicht nur präziser, sondern auch schneller bei der Messung. Geräte werden kleiner und kosten viel günstiger als je zuvor. Zum Beispiel neue Technologien wie die oszillierende Mikrowaage mit konischem Element (TOEM) bieten erhebliche Vorteile gegenüber den herkömmlichen Beta-Dämpfungsmonitoren (BAM)
Noch in jüngster Zeit tauchen äußerst erschwingliche Sensoren auf dem Markt auf – viele davon stehen im Zusammenhang mit dem IOT-Trend der Sensorik alles. Während es sich bei den meisten von ihnen um reine Spielerei und damit definitiv um nutzlose Spielzeuge handelt, erreichen einige von ihnen mittlerweile eine Leistung, die mit professionellen Monitoren vergleichbar ist, und das bei hundertmal geringeren Kosten. Um die Zuverlässigkeit dieser Sensoren zu beurteilen, führen die Earth Sensing Labs des World Air Quality Index-Projekts seit vielen Jahren zahlreiche Luftqualitätssensor-Forschungen und Live-Datenexperimente durch.
Partikelsensoren
Die Partikelsensoren können die Staubmenge in der Luft erfassen. Während die erste Generation nur den Grad der Trübung erkennen konnte, können die neuesten Sensoren jetzt nicht mehr PM2,5 und PM10, sondern auch bis zu 7 verschiedene Partikelgrößen (auch bekannt als PM) erkennen Behälter).
Laser based PM2.5/PM10 sensor
20USD (130CN¥)
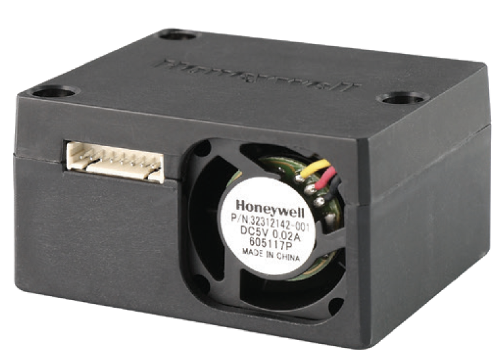
Laser based PM2.5/PM10 sensor
20USD (130CN¥)
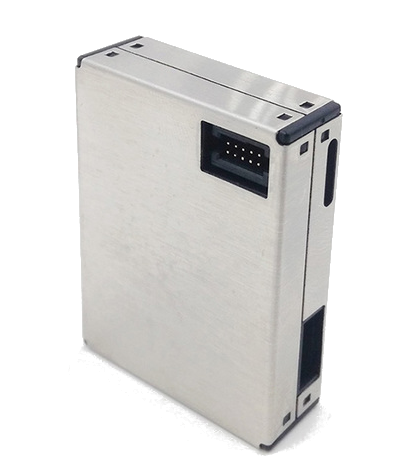
Laser based PM2.5/PM10 sensor
18USD (120CN¥)
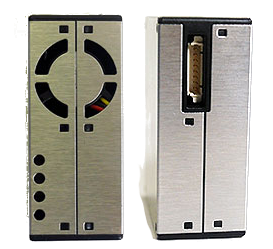
Laser based PM2.5/PM10 sensor
14USD (90CN¥)
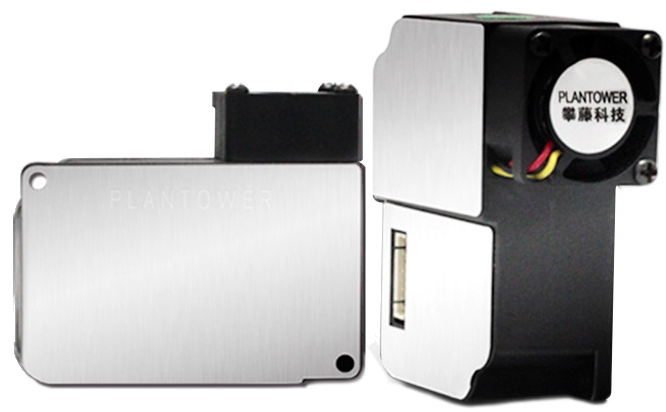
Laser based PM2.5/PM10 sensor
14USD (90CN¥)
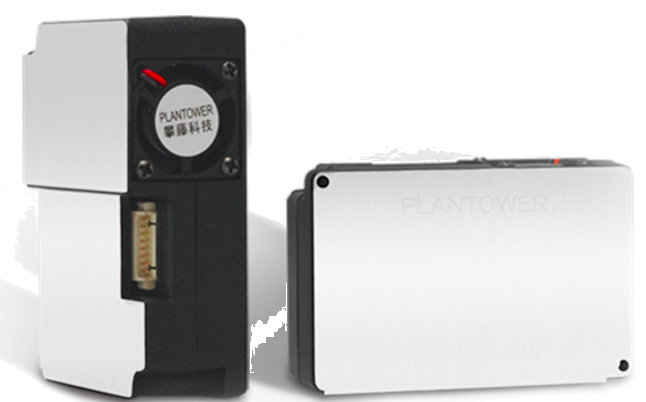
Laser based PM2.5/PM10 sensor
24USD (160CN¥)
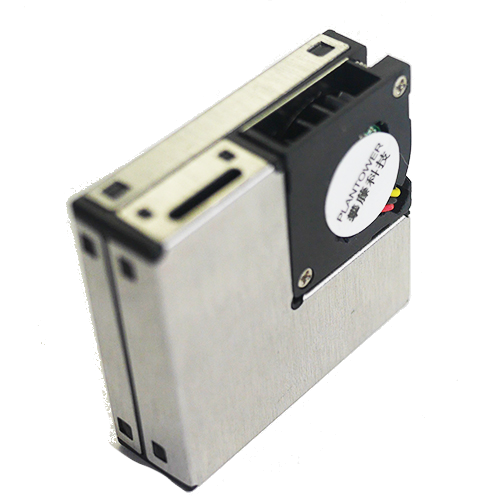
Laser based PM2.5/PM10 sensor
23USD (150CN¥)
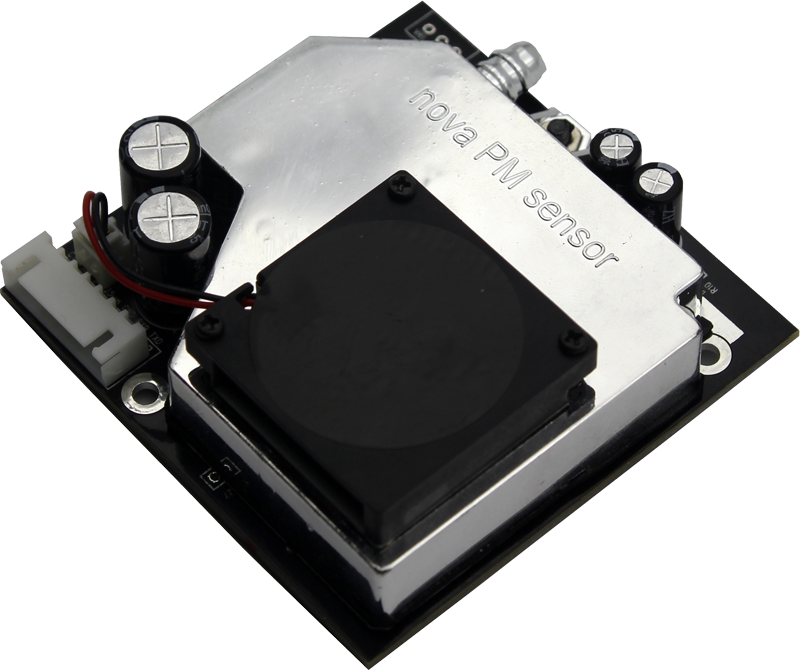
Laser based PM2.5/PM10 sensor
19USD (128CN¥)
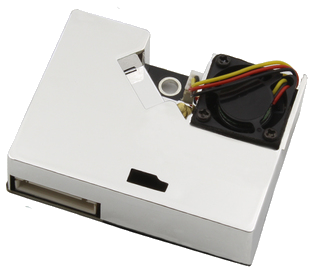
Laser based PM2.5/PM10 sensor
23USD (155CN¥)
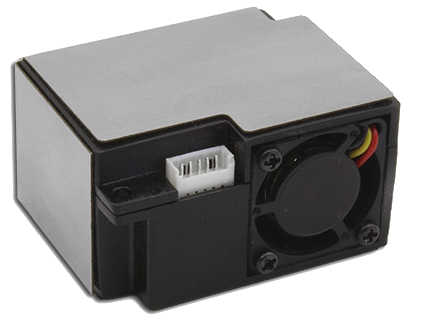
Laser based PM2.5/PM10 sensor
20USD (130CN¥)
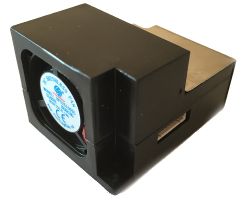
Virtual Impactor for Sharp
GP2Y1051AU0F
20USD (135CN¥)
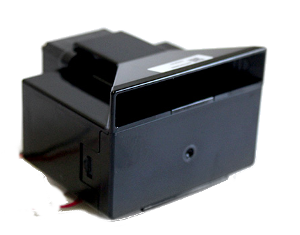
LPO Optical PM sensor
5USD (35CN¥)
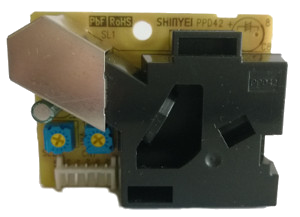
LPO Optical PM sensor
4USD (24CN¥)
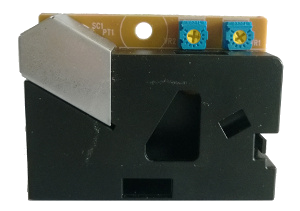
Analog Optical PM sensor
5USD (35CN¥)
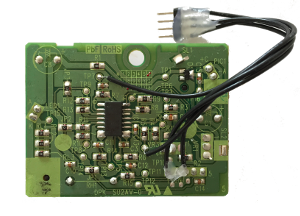
Laser based PM2.5/PM10
integrated monitor
300USD (2000CN¥)
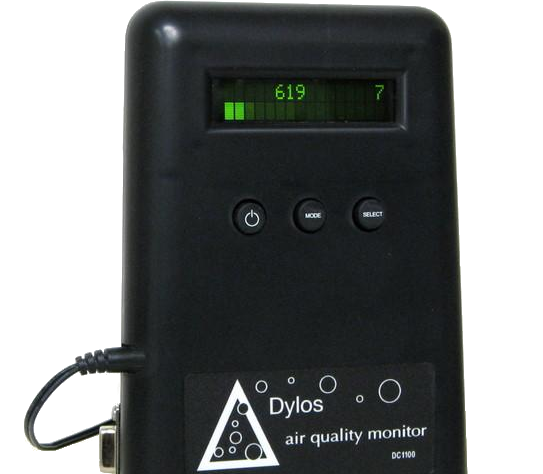
Laser based PM2.5/PM10 sensor
500USD (3333CN¥)
Gassensoren
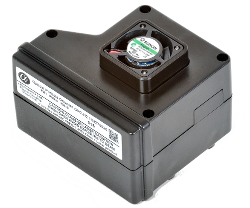
Im Gegensatz zu Partikelsensoren kann der Gassensor die Art der in der Luft vorhandenen Partikel erkennen und zählen, wie zum Beispiel Ozon (O3), Stickstoffdioxid ( NO2), Schwefeldioxid (SO2), ...
Ozone Electro-Chemical sensor
60CNY
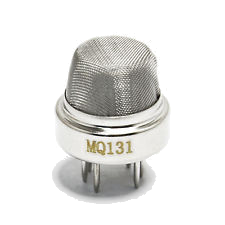
Ozone Electro-Chemical sensor
57USD (380 CN¥)
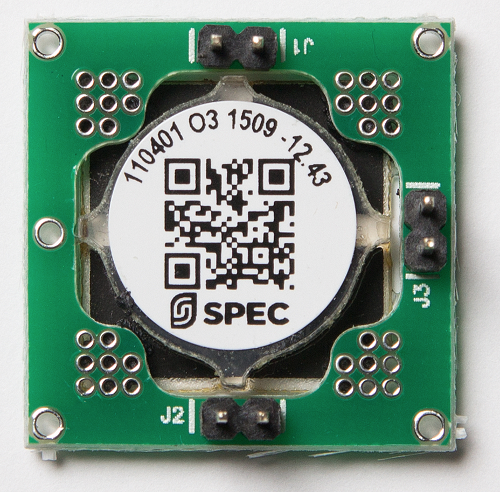
Ozone MEMS sensor
18USD (120 CN¥)
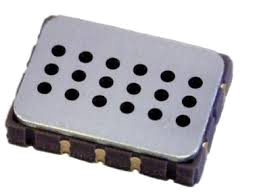
NO2 MEMS sensor
23USD (150 CN¥)

NO2 Electro-Chemical sensor
90USD (600 CN¥)
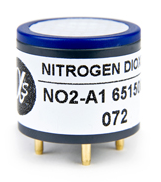
Carbon Monoxyde Electro-Chemical sensor
5CNY

Anmerkungen
- Hinweis 1: Der USD/CNY-Umrechnungskurs basiert auf 1 CNY = 0,15 USD. Der Preis basiert auf dem Direktkauf beim Anbieter ohne Versandkosten.
- Hinweis 2: Der Dylos-Monitor gehört nicht wirklich zur Kategorie der PM-Sensoren, da es sich um ein vollständig integriertes und eigenständiges Überwachungsgerät handelt, das viel teurer als jeder andere Sensor ist, aber aus historischen Gründen hier aufgeführt wird.
- Hinweis 3: Das Alpha Sense OPCN2 ist teuer und der Preis, den Sie zahlen, gilt für die rückverfolgbare Kalibrierung (durchgeführt unter Verwendung sphärischer Polystyrol-Latexpartikel). Ansonsten bietet es aus technologischer Sicht nichts Besseres als das, was die 20-Dollar-Sensoren leisten können, außer von einem IC.
- Note4: There are many scientific article on low-cost sensor. See the one from NCAS and WACL for an excellent and brief overview on the evaluation of low cost chemical sensors for air pollution measurement.
Vergleichsmessung PM2,5 der letzten 5 Tage
--
