データアップロードAPIとサンプルスクリプト

最初のステップは、データ プラットフォーム ページからトークンを取得することです。

独自のトークンを取得したら、次のスクリプトを使用してデータをアップロードできます。最初のステーション データをアップロードした後、aqicn.org/data-feed/verification/ に移動してステーションを設定し、アップロードされたデータを確認します。

サポートされているソフトウェア プラットフォーム:

これら 3 つのプラットフォーム用にすぐに使用できるソフトウェアを提供します。

  • Arduino: Arduino CPU をお持ちの場合は、github.com (aqicn/gaia-a08-arduino
  • Python: 以下のコード スニペットを使用します。
  • コマンド ライン (CURL): 以下のコード スニペットを使用します。

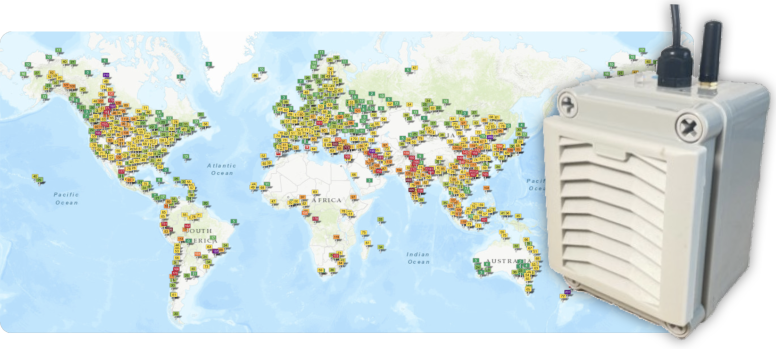
モニタリング ステーションをお持ちでなく、入手したい場合は、GAIA 大気質モニタリング ステーションを確認してください。

DIY ステーションをお好みの場合は、GAIA A08 をチェックしてください。


--

サンプルコード(Python)

import requests  
 
# Sensor parameter   
sensorReadings = [   
	{'specie':'pm25', 'value': 393.3},  
	{'specie':'pm10', 'value': 109.3}  
] 
 
# Station parameter   
station = { 
	'id':		"station-001",  
	'location':  { 
		'latitude': 28.7501,  
		'longitude': 77.1177 
	} 
} 
 
# User parameter - get yours from https://aqicn.org/data-platform/token/ 
userToken = "dummy-token-for-test-purpose-only" 
 
# Then Upload the data  
params = {'station':station,'readings':sensorReadings,'token':userToken}  
request = requests.post( url = "https://aqicn.org/sensor/upload/",  json = params) 
#print(request.text) 
data = request.json()  
 
if data["status"]!="ok": 
	print("Something went wrong: %s" % data) 
else: 
	print("Data successfully posted: %s"%data) 

サンプルコード(カール)

curl -X POST https://aqicn.org/sensor/upload -H 'Content-Type: application/json' --data '{\ 
"token": "dummy-token-for-test-purpose-only",\ 
"station": { "id": "station-001" },\ 
"readings": [{"specie":"pm2.5", "value": 393.3}]\ 
}'

サンプルコード(Arduino)

Check github.com/aqicn/gaia-a08-arduino for the full code.
#include <WiFi.h> 
#include <HTTPClient.h> 
#include <ArduinoJson.h> 
 
#define LATITUDE 28.7501 
#define LONGITUDE 77.1177 
 
void upload(float pm25_concentration, float pm10_concentration, const char * token) 
{ 
 
    static char stationID[32]; 
    uint64_t efuseMac = ESP.getEfuseMac(); 
    uint16_t chip = (uint16_t)(efuseMac >> 32); 
    snprintf(stationID, 32, "station-%x", chip); 
 
    doc["token"] = token; 
    doc["station"]["id"] = stationID; 
 
    doc["station"]["location"]["latitude"] = LATITUDE; 
    doc["station"]["location"]["longitude"] = LONGITUDE; 
 
    doc["readings"][0]["specie"] = "pm25"; 
    doc["readings"][0]["value"] = pm25_concentration; 
    doc["readings"][0]["unit"] = "µg/m3"; 
 
    doc["readings"][1]["specie"] = "pm10"; 
    doc["readings"][1]["value"] = pm10_concentration; 
    doc["readings"][1]["unit"] = "µg/m3"; 
 
    static char json_body[1024]; 
    serializeJson(doc, json_body); 
 
    HTTPClient http; 
    http.begin("https://aqicn.org/sensor/upload"); 
    http.addHeader("Content-Type", "application/json"); 
    int httpResponseCode = http.POST(json_body); 
 
    if (httpResponseCode > 0) 
    { 
 
        String response = http.getString(); 
        Serial.println(httpResponseCode); 
        Serial.println(response); 
    } 
    else 
    { 
 
        Serial.print("Error on sending POST: "); 
        Serial.println(httpResponseCode); 
    } 
 
    http.end(); 
}
APIオプション

Parameter Type Optional/Mandatory Explanations
token string mandatory

aqicn.org/data-platform/token から独自のトークンを取得します。

station
station.id string mandatory

一意のステーション ID - 最大 128 文字の任意の名前を選択できます。
この名前は内部でのみ使用されます。他の人はこの ID を見ることはできません

station.name string optional

測候所の名前 - たとえば、建物の名前、通りの名前、大学の学部の名前、個人の気象観測所のコードなどが考えられます。
この名前はステーション URL の接尾辞として使用されます。

station.latitude float optional

あなたの駅の経度

station.longitude float optional

あなたの駅の経度

organization
org.website string optional

ステーションやセンサーに関する詳細情報を掲載している Web サイトをお持ちの場合は、ステーションを表示する際にこのリンクを地図に追加します。

org.name string optional

Web サイトを指定すると、この「組織名」が Web サイトに関連付けられます。

readings
readings[*].specie string mandatory

報告している汚染物質の名前。ガスセンサーの場合は、「pm2.5」、「pm10」、「pm1.0」などを使用します。ガスセンサーの場合は、「co2」、「no2」、「o3」などを使用します。天気センサーの場合、使用: 「温度」、「湿度」、「圧力」、「風速」、「突風」、「風向」、..
実際には、任意の種名を使用できます。ステーションが検証されると、名前はシステムで正規化されます。

readings[*].value float mandatory

センサーが毎秒値を生成し、毎分アップロードするだけの場合、この値は過去 1 分間に読み取られたすべての値の平均である必要があります。

readings[*].unit string optional

値の単位。例:粉塵センサーの場合は「mg/m3」、ガスセンサーの場合は「ppb」、温度センサーの場合は「C」。

readings[*].time string optional

ISO 8601 形式での読み取り日時

readings[*].min float optional

読み取り値が複数の値の平均に基づいている場合、これは平均に使用されるすべての値の最小値に対応します。

readings[*].max float optional

読み取り値が複数の値の平均に基づいている場合、これは平均に使用されるすべての値の最大値に対応します。

readings[*].median float optional

読み取り値が複数の値の平均に基づいている場合、これは平均に使用されるすべての値の中央値に対応します。

readings[*].stddev float optional

読み取り値が複数の値の平均に基づいている場合、これは平均に使用されたすべての値の標準偏差に対応します。

readings[*].averaging float optional

上記の値が複数の値の平均に基づいている場合、これは平均化期間の継続時間 (秒単位) に対応します。
たとえば、1 分間の平均データには 60 を使用し、時間平均データには 3600 を使用します。

例1

{ 
	"token": "......", 
	"station": { 
		"id": "station-001", 
		"name": "HCPA Santa Cecília", 
		"latitude": 103.37893, 
		"longitude": 43.17108, 
	}, 
	"org": { 
		"website":"https://pacto.upsensor.com/", 
		"name":"Porto Ar Alegre", 
	}, 
	"readings": [ 
		{"time":"2024-12-22T00:51:25+09:00","specie":"pm2.5", "value": 393.3, "unit":"mg/m3", "min":390.3, "max": 402.3, "stddev": 0.332},  
		{"time":"2024-12-22T00:51:25+09:00","specie":"pm10", "value": 109.3, "unit":"mg/m3"}, 
		{"time":"2024-12-22T00:51:25+09:00","specie":"co2", "value": 459.3, "unit":"ppb"}, 
		{"time":"2024-12-22T00:51:25+09:00","specie":"temp", "value": 26.8, "unit":"C"}, 
	] 
}

例 2

{ 
	"token": "......", 
	"station": { 
		"id": "station-001", 
	}, 
	"readings": [ 
		{"specie":"pm2.5", "value": 393.3} 
	] 
}

完全なコード例

このコードを使用すると、SDS センサーから継続的に読み取り、毎分アップロードできます (スクリプトは https://github からも入手できます) .com/aqicn/sds-sensor-reader)。

import requests 
import random 
import time 
import math 
import json 
import sys 
from serial import Serial 
 
LOCATION = {'latitude': 28.7501, 'longitude': 77.1177} 
TOKEN    = "dummy-token-for-test-purpose-only" 
SENSORID = "station-001" 
USBPORT  = "/dev/ttyUSB0" 
 
class SensorDataUploader: 
 
    def __init__(self, station, token): 
        self.token = token 
        self.station = station 
 
 
    def send(self,readings): 
 
        params = {'station':self.station,'readings':readings,'token':self.token}  
        print("Uploading: %s"%json.dumps(params, indent=4)) 
 
        request = requests.post( url = "https://aqicn.org/sensor/upload/",  json = params) 
        data = request.json()  
        if data["status"]!="ok": 
            print("Something went wrong: %s" % data) 
        else: 
            print("Data successfully posted: %s"%data) 


class Accumulator: 
 
    def __init__(self, name): 
        self.name = name 
        self.values = [] 
 
    def add(self,val): 
        self.values.append(val) 
 
    def count(self): 
        return len(self.values) 
 
    def reset(self): 
        self.values=[] 
 
    def min(self): 
        return self.values[0] 
 
    def max(self): 
        return self.values[len(self.values)-1] 
 
    def median(self): 
        return self.values[len(self.values)/2] 
 
    def mean(self): 
        return float(sum(self.values)) / len(self.values) 
 
    def stddev(self): 
        l = len(self.values) 
        mean = self.mean() 
        return math.sqrt(float(reduce(lambda x, y: x + y, map(lambda x: (x - mean) ** 2, self.values))) / l) 
 
 
    def summary(self): 
        self.values.sort() 
        return {"specie":self.name,'value':self.mean(),'min':self.min(),'max':self.max(),'median':self.median(), 'stddev':self.stddev()}  


class DummyReader: 
 
    def read( self ): 
 
        time.sleep(1.1) 
        return {"pm2.5":random.random()*10,"pm10":random.random()*10} 
 
 
class SDS011Reader: 
 
    def __init__(self, inport): 
        self.serial = Serial(port=inport,baudrate=9600) 
        self.values = [] 
        self.step = 0 
 
    def read( self ): 
 
        # time.sleep(1) 
        # return {"pm2.5":random.random()*100,"pm10":random.random()*100} 
 
        while self.serial.inWaiting()!=0: 
            v=ord(self.serial.read()) 
 
            if self.step ==0: 
                if v==170: 
                    self.step=1 
 
            elif self.step==1: 
                if v==192: 
                    self.values = [0,0,0,0,0,0,0] 
                    self.step=2 
                else: 
                    self.step=0 
 
            elif self.step>8: 
                self.step =0 
                pm25 = (self.values[0]+self.values[1]*256)/10 
                pm10 = (self.values[2]+self.values[3]*256)/10 
                return {"pm2.5":pm25,"pm10":pm10} 
 
            elif self.step>=2: 
                self.values[self.step-2]=v 
                self.step= self.step+1 
 
        return None 


def readAndUpload(sensor, uploader): 
 
    try: 
 
        while True: 
            accumulators = {} 
            startTime = time.time() 
 
            while time.time() < startTime+60: 
                values = sensor.read() 
                if values==None: 
                    continue 
 
                print("Reading [%2d]: %s"%(int(time.time()-startTime),values)) 
                for specie, value in values.items(): 
                    if not (specie in accumulators): 
                        accumulators[specie]=Accumulator(specie) 
                    accumulators[specie].add(value) 
 
 
            readings = [] 
            for specie, accumulator in accumulators.items(): 
                readings.append(accumulator.summary()) 
 
            if len(readings)>0: 
                uploader.send(readings) 
            else: 
                print("No value read from the sensor...") 
 
 
    except KeyboardInterrupt: 
        print "Bye" 
        sys.exit() 


print("Starting reading sensor "+SENSORID+" on port "+USBPORT) 
 
# Station parameter   
station = {'id':SENSORID, 'location':LOCATION} 
uploader = SensorDataUploader(station, TOKEN) 
 
sensor = SDS011Reader(USBPORT) 
# sensor = DummyReader() 
readAndUpload(sensor,uploader) 
 

あなたの地域の大気質測定ステーションを知っていますか?
あなた自身の大気質ステーションでマップに参加してみませんか?

当社の GAIA 空気質モニターはセットアップが非常に簡単です。必要なのは、Wi-Fi アクセス ポイントと USB 対応の電源だけです。

接続すると、リアルタイムの大気汚染レベルが地図上および API を通じて即座に確認できるようになります。

ステーションには、10 メートルの防水電源ケーブル、USB 電源、取り付け装置、オプションのソーラー パネルが付属しています。

大気汚染指数の測定方法:

大気汚染レベルについて

指数 大気質指数の分類(米国) 健康影響 / カテゴリ 粒子状物質(PM10,PM2.5)
0 - 50 良い - Good 通常の活動が可能 なし
51 -100 並 - Moderate 特に敏感な者は、長時間又は激しい屋外活動の減少を検討 非常に敏感な人は、長時間または激しい活動を減らすよう検討する必要がある。
101-150 敏感なグループにとっては健康に良くない - Unhealthy for Sensitive Groups 心臓・肺疾患患者、高齢者及び子供は、長時間又は激しい屋外活動を減少 心疾患や肺疾患を持つ人、高齢者、子供は、長時間または激しい活動を減らす必要がある。
151-200 健康に良くない - Unhealthy 上記の者は、長時間又は激しい屋外活動を中止
すべての者は、長時間又は激しい屋外活動を減少
心疾患や肺疾患を持つ人、高齢者、子供は、長時間または激しい活動を中止する必要がある。それ以外の人でも、長時間または激しい活動を減らす必要がある。
201-300 極めて健康に良くない - Very Unhealthy 上記の者は、すべての屋外活動を中止
すべての者は、長時間又は激しい屋外活動を中止
心疾患や肺疾患を持つ人、高齢者、子供は、全ての屋外活動を中止する必要がある。それ以外の人でも、長時間または激しい活動を中止する必要がある。
300+ 危険 - Hazardous 上記の者は、屋内に留まり、体力消耗を避ける
すべての者は、屋外活動を中止
全ての人が屋外活動を中止する必要がある。特に、心疾患や肺疾患を持つ人、高齢者、子供は、屋内に留まって激しい活動を避け静かに過ごす必要がある。
(Reference: see wikipedia, and cn.emb-japan.go.jp/)

大気汚染についての更なる詳細をお知りになりたい方は、WikipediaAirNowを参照してください。

北京在住の医師Richard Saint Cyr氏による大変役に立つ健康上のアドバイスは、 www.myhealthbeijing.com をご覧ください。


使用上の注意: すべての大気質データは公開時点では妥当性が担保されていないため、これらのデータは予告なしに修正することがあります。 世界大気質指数プロジェクトは、この情報の内容を編集に最善の注意を尽くしておりますが、いかなる状況においても World Air Quality Index プロジェクトチームまたはそのエージェントは、このデータの供給によって直接的または間接的に生じる損失や損害について責任を負いません。


設定


言語を選択:


Temperature unit:
Celcius