When it comes to measuring Air Quality, the golden standard nowdays is to measure PM2.5, also known as small respirable particle matter. That was however not the case few years ago, when the golden standard was still about measuring PM10, also known as standard particle matter, as well as other Volatile Oganic Compounds (aka VOC, which includes Ozone, NO2, SO2 and CO).
The reason for upgrading from PM10 to PM2.5, explained by Dr Sarath Guttikunda in this explantion about PM10 vs PM2.5 is that there are now new studies presenting evidence that PM2.5 is more harmful than PM10. As Dr Dr Sarath Guttikunda sates in the article, “physically, this makes sense since smaller than particle have a higher probability to go deeper into the lungs and harm people”.Many countries, like China have done tremendous efforts in modernizing their monitoring equipement to the PM2.5 standard. Howerver, there are still quite a lot of countries not yet providing PM2.5 data, but only PM10. And among those countries with only PM10 data, the most surprising one in South Korea (with the exception of Seoul).
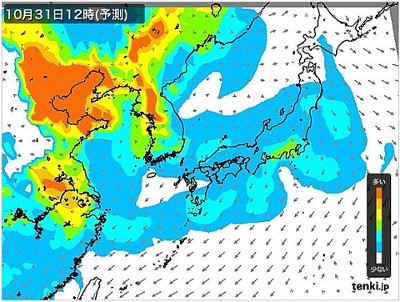
It is surprising since the Air Quality in South Korea is very similar to it's neighboors countries, namely Japan and China - where PM2.5 AQI is quite often peaking above 200, while PM10 AQI is acceptable and below 100. From the picture on the right (taken from tenki.jp), which represent the PM2.5 data flux, there is no doubt that South Korea is suffering from the same PM2.5 high densities as China and Japan.
Correlating PM2.5 and PM10
Please wait while loading data...
Note that the ordinate axis scale is different for PM10 and PM2.5, so although the graphs overlap, the values are actually different. From the correlation graph, there is just no doubt that there is a very strong linear correlation for the PM10 and PM2.5 concentration. The pearsons cooeficient for the last 30 days is . The resulting linear regression is defined with this formula:
Also, it is worth noticing that there are three periods where PM10 is significantly devaiting from PM2.5, two between October 27th and November 3rd, and one arround November 18th. This usually occurs during sand storms.
Deducting PM2.5 from PM10
The graph on the right shows the mass to AQI convertion formula. The absissa (x axis) is the mass (in milligrams) and the ordinate (y axis) is the AQI. The two graphs correspond to the PM10 and PM2.5 deducted from PM10 readings. Note that it empirically confirms the hypothesis that PM2.5 AQI is always higher than PM10 when the PM10 mass is not too hight (in this case, lower than 480 milligrams).
PM2.5 deducted map
Actual PM10 AQI
Interpolated PM2.5 AQI
Actual PM2.5 AQI
Important notes
- First, this convertion only applies to the PM10 readings, and in summer, the Ozone tends to be very often the major pollutant. So, if you do the convertion yourself, please, make sure that you are converting the PM10 AQI and not the overall AQI, which is defined as the maximum of all individual AQIs.
- Second, this is an experiment, and despite having a very good coorelation cooeficient (pearsons factor is 0.96) between PM10 and PM2.5, there are some days where PM10 is much higher than PM2.5 (for instance, check this experiment about PM10 vs PM2.5). Those days, the convertion formula should not be used.
- Last, the linear regression equation is very specific to the place where you measure the data. This is also known as the "dust type" property, which says that the "typical" dust in South Korea is different from the one in US or Malaysia. This means that this formula should be updated if used outside of South Korea. Duing this summer, we will start a new reasearch where will will study the PM10 / PM2.5 correlation factors accros different countries.
Conclusion
...
--
Note that the data provided is this article follows the Korea Open Government License (kogl.or.kr)


