Simulating PM2.5 Air Quality when only PM10 is available: case study for South Korea

Experiment published on Thursday, July 31st, 2014
[updated on Saturday, January 11th, 2020]

When it comes to measuring Air Quality, the golden standard nowdays is to measure PM2.5, also known as small respirable particle matter. That was however not the case few years ago, when the golden standard was still about measuring PM10, also known as standard particle matter, as well as other Volatile Oganic Compounds (aka VOC, which includes Ozone, NO2, SO2 and CO).


PM2.5 forecast from www.tenki.jp
The reason for upgrading from PM10 to PM2.5, explained by Dr Sarath Guttikunda in this explantion about PM10 vs PM2.5 is that there are now new studies presenting evidence that PM2.5 is more harmful than PM10. As Dr Dr Sarath Guttikunda sates in the article, “physically, this makes sense since smaller than particle have a higher probability to go deeper into the lungs and harm people”.

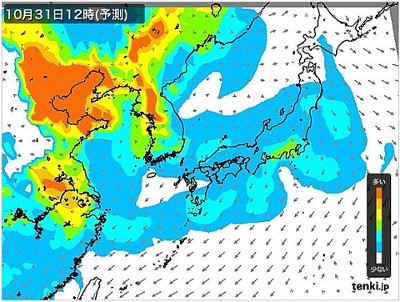
Many countries, like China have done tremendous efforts in modernizing their monitoring equipement to the PM2.5 standard. Howerver, there are still quite a lot of countries not yet providing PM2.5 data, but only PM10. And among those countries with only PM10 data, the most surprising one in South Korea (with the exception of Seoul).

It is surprising since the Air Quality in South Korea is very similar to it's neighboors countries, namely Japan and China - where PM2.5 AQI is quite often peaking above 200, while PM10 AQI is acceptable and below 100. From the picture on the right (taken from tenki.jp), which represent the PM2.5 data flux, there is no doubt that South Korea is suffering from the same PM2.5 high densities as China and Japan.
Note: This article was written in 2014. Since then, all stations in South Korea provide PM2.5 data.

Correlating PM2.5 and PM10

So, the question that we would like to answer is: Can we deduct the PM2.5 AQI when only PM10 data readings are avaialble? The answer is yes, and the main reason is that there is a very strong correlation between the PM10 and PM2.5 mass concentration. The South Korea governement has recently released, for few stations, both PM10 and PM2.5 hourly concentration data, and this will be the basis for this experiment. The graph below shows the last 30 days concentration for the station 경기 탄벌동 (gyeong-gi tanbeoldong) for both PM10 and PM2.5:


Please wait while loading data...


Note that the ordinate axis scale is different for PM10 and PM2.5, so although the graphs overlap, the values are actually different. From the correlation graph, there is just no doubt that there is a very strong linear correlation for the PM10 and PM2.5 concentration. The pearsons cooeficient for the last 30 days is . The resulting linear regression is defined with this formula:


Also, it is worth noticing that there are three periods where PM10 is significantly devaiting from PM2.5, two between October 27th and November 3rd, and one arround November 18th. This usually occurs during sand storms.

Deducting PM2.5 from PM10

So, all we need to convert the PM10 AQI into the PM2.5 AQI, is to stretch the mass scale from PM10 to PM2.5 to determince the corresponding PM2.5 mass value from the PM10 reading, and finally use the PM2.5 AQI scale to deduct the final AQI.

The graph on the right shows the mass to AQI convertion formula. The absissa (x axis) is the mass (in milligrams) and the ordinate (y axis) is the AQI. The two graphs correspond to the PM10 and PM2.5 deducted from PM10 readings. Note that it empirically confirms the hypothesis that PM2.5 AQI is always higher than PM10 when the PM10 mass is not too hight (in this case, lower than 480 milligrams).

PM2.5 deducted map

From the two maps below, the one titled "Interpolated PM2.5 AQI" is using the above formula to show what the "actual" Air Quality could be, if PM2.5 stations would be used. The result is indeed quite scarying, but on the other hand, that's not a surprise: The PM2.5 AQI is much more strict than the PM10 AQI, as explained in the begiging of this article (see explantion about PM10 vs PM2.5).

Actual PM10 AQI
Interpolated PM2.5 AQI
Actual PM2.5 AQI


Important notes

Before concluding, there are few very important points to mention:
  • First, this convertion only applies to the PM10 readings, and in summer, the Ozone tends to be very often the major pollutant. So, if you do the convertion yourself, please, make sure that you are converting the PM10 AQI and not the overall AQI, which is defined as the maximum of all individual AQIs.

  • Second, this is an experiment, and despite having a very good coorelation cooeficient (pearsons factor is 0.96) between PM10 and PM2.5, there are some days where PM10 is much higher than PM2.5 (for instance, check this experiment about PM10 vs PM2.5). Those days, the convertion formula should not be used.

  • Last, the linear regression equation is very specific to the place where you measure the data. This is also known as the "dust type" property, which says that the "typical" dust in South Korea is different from the one in US or Malaysia. This means that this formula should be updated if used outside of South Korea. Duing this summer, we will start a new reasearch where will will study the PM10 / PM2.5 correlation factors accros different countries.

Conclusion

As a conclusion, provided you take all the precautions related to the 3 remarks above, you could use the following convertion table to calculate the actual AQI:
...


--


Note that the data provided is this article follows the Korea Open Government License (kogl.or.kr)


À propos de la qualité de l'air et des mesures de la pollution atmosphérique :

À propos des niveaux de qualité de l'air

IQANiveau de pollution de l'air Impact sur la santé
0 - 50BonLa qualité de l'air est jugée satisfaisante, et la pollution de l'air pose peu ou pas de risque.
51 -100ModéréLa qualité de l'air est acceptable. Cependant, pour certains polluants, il peut y avoir un risque sur la santé pour un très petit nombre de personnes inhabituellement sensibles à la pollution atmosphérique.
101-150Mauvais pour les groupes sensiblesLa qualité de l'air est acceptable; Cependant, pour certains polluants, il peut y avoir un problème de santé modérée pour un très petit nombre de personnes qui sont particulièrement sensibles à la pollution de l'air.
151-200MauvaisTout le monde peut commencer à ressentir des effets sur la santé; les membres des groupes sensibles peuvent ressentir des effets de santé plus graves.
201-300Très mauvaisAvertissements de santé de conditions d'urgence. Toute la population est plus susceptible d'être affecté.
300+DangereuxAlerte de santé: tout le monde peut ressentir des effets de santé plus graves.

Pour en savoir plus sur la qualité de l'air, consultez le sujet Qualité de l'air sur Wikipedia ou le guide AirNow de la qualité de l'air et de votre santé .

Pour des conseils de santé très utiles du Dr. Richard Saint Cyr, consultez le blog myhealthbeijing.com.


Notice d'utilisation: Toutes les données sur la qualité de l'air ne sont pas validées au moment de la publication et, pour des raisons d'assurance de la qualité, ces données peuvent être modifiées à tout moment et sans préavis. Le projet Indice de la qualité de l'air dans le monde a exercé toutes les compétences et l'attention réalisables dans la compilation du contenu de ces informations. Indice de la qualité de l’air dans le monde , l’équipe de projet ou ses agents ne peuvent être tenus responsables, contractuellement, judiciairement ou autrement, de toute perte, blessure ou préjudice résultant directement ou indirectement de la fourniture de ces données.


Paramètres


Choix de la langue :


Temperature unit:
Celcius