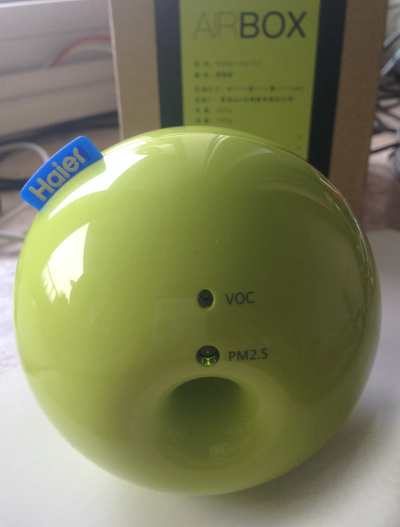
Haier's new AirBox (photo on the right) is very beautifully designed Air Quality sensor, aimed, as part of their smart living concept, at beeing used in conjonction with smart air conditionner. It claims to be able to sense not only Temperature, Humidity and VOC (Volatile Organic Compound), but also the famous small PM2.5 particulate matter.
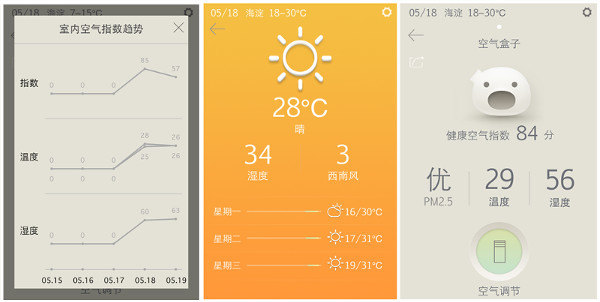
From a marketign point of view, that's a beautiful storry. But, technically, that's something very different.... First, their smartphone application does not provide the real-time data graphics - but only the daily summary and a instant number which is hard to relate to anthing, as you can see from the screen shots below (taken from leiphone.com/d-haier-air-box.html). There is a simple reason for which they do not provide the real-time graphics, updated very minutes or so: it is because their sensor is so poor that it can't detect any variation in Air Quality! You can check it by yourself from the graphs are the bottom of this article (the voc and pm2.5 readings seems to be stuck to a value of 20, regarless of the actual air quality)
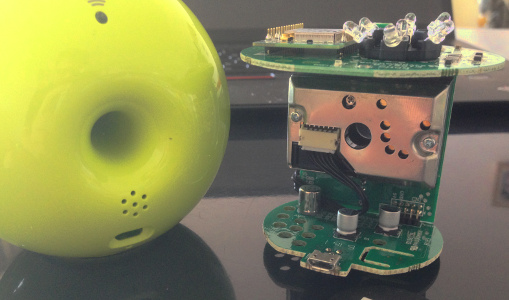
Second, the hardware sensor they use to detect the PM2.5 particulate matter is no more than the low-cost Sharp gp2y1010au0f module. This sharp sensor is pretty much useless if you want want to get any accurate data, at least when used without any kind of data and signal processing (see our low-cost sensor experiment page). So, considering that it only uses a simple 8 bits AVR (the Spansion MB95F698K, F2MC-8FX CPU core) with only has 2KB of RAM, there's just no hope for having any kind of relevant data processing algorithm which could give relevant readings.
As a first conclusion, there is no doubt that the inherent hardware design has significant limitations on the quality of the air sensing readings. But to double confirm the conclusion with some more empericaly data, the last 30 days real-time readings from the Air Box are provided below:
Please wait while loading data...

- From time to time, data is missing. The reason is that the WIFI router on which the Haier air box is connected will automatically switch off from time to time (especially during the night). During this period, data can not be uploaded from the airbox to the Haier server. But, even worse, considering that there is not enough memory storage on the airbox AVC, there is just no way to buffer the accumlated data and send it in bulk mode when the WIFI is available again. That's really a bad design, and that's at least something that is handled in our dylos experiment setup.
- The PM2.5 and VOC is desperetly stuck to discreet values such as 20 or 80. That's annoying considering that the airbox is located outside, and the measurement should reflect the actual air pollution, which you can see on the "BAM and Dylos" graph. One should expect the PM2.5 and VOC graphs to vary much more from hour to hour, and out of 1 month of collected data, there is no doubt that the readings provided by the Hair Air Box are highly not reialable.
Based on the above analysis, the Haier Air Box is disappointing. For sure, it can not be used for getting any accurate Air Quality information. Eventually, the temperature sensor is working fine, so it will be an ok solution for turning the Air Conditionner on and off based on the living temperature. But, this is a bit of an expensive IOT equipment, and one would expect much more from Haier. So, let's wait and see, hopefully they are already working on the next generation of this IOT Smart Living equipement.
--
For those interrested in the complete reverse engineering, you can check the page: ewisetech.com or the leiphone.com for hardware. For the network protocol reverse engineering, check biaji.net . And for those interested in extracting the data from their sensors, our scripts are avialble from github.com
--

