Data Upload API & Samples scripts

The first step is to get a token from data-platform page.

Once you have your own token, you can use the following script to upload your data. After you upload your first station data, go to aqicn.org/data-feed/verification/ to configure your stations and verify the uploaded data.

Supported Software Platforms:

We provide the ready to use software for those 3 platforms:

  • Arduino: If you have an Arduino CPU, use the ready-to-use software available on github.com at aqicn/gaia-a08-arduino.
  • Python: Use the code-snippet below
  • Command line (CURL): Use the code-snippet below

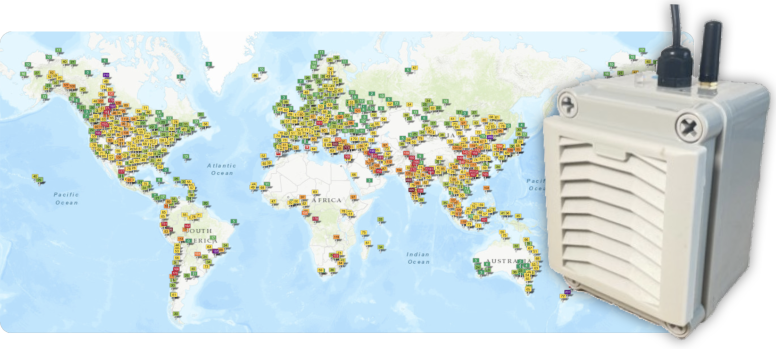
If you do not have any monitoring station, and would like to get one, check our GAIA Air Quality monitoring stations.

If you prefer a DIY station, check the GAIA A08.


--

Sample code (python)

import requests  
 
# Sensor parameter   
sensorReadings = [   
	{'specie':'pm25', 'value': 393.3},  
	{'specie':'pm10', 'value': 109.3}  
] 
 
# Station parameter   
station = { 
	'id':		"station-001",  
	'location':  { 
		'latitude': 28.7501,  
		'longitude': 77.1177 
	} 
} 
 
# User parameter - get yours from https://aqicn.org/data-platform/token/ 
userToken = "dummy-token-for-test-purpose-only" 
 
# Then Upload the data  
params = {'station':station,'readings':sensorReadings,'token':userToken}  
request = requests.post( url = "https://aqicn.org/sensor/upload/",  json = params) 
#print(request.text) 
data = request.json()  
 
if data["status"]!="ok": 
	print("Something went wrong: %s" % data) 
else: 
	print("Data successfully posted: %s"%data) 

Sample code (curl)

curl -X POST https://aqicn.org/sensor/upload -H 'Content-Type: application/json' --data '{\ 
"token": "dummy-token-for-test-purpose-only",\ 
"station": { "id": "station-001" },\ 
"readings": [{"specie":"pm2.5", "value": 393.3}]\ 
}'

Sample code (arduino)

Check github.com/aqicn/gaia-a08-arduino for the full code.
#include <WiFi.h> 
#include <HTTPClient.h> 
#include <ArduinoJson.h> 
 
#define LATITUDE 28.7501 
#define LONGITUDE 77.1177 
 
void upload(float pm25_concentration, float pm10_concentration, const char * token) 
{ 
 
    static char stationID[32]; 
    uint64_t efuseMac = ESP.getEfuseMac(); 
    uint16_t chip = (uint16_t)(efuseMac >> 32); 
    snprintf(stationID, 32, "station-%x", chip); 
 
    doc["token"] = token; 
    doc["station"]["id"] = stationID; 
 
    doc["station"]["location"]["latitude"] = LATITUDE; 
    doc["station"]["location"]["longitude"] = LONGITUDE; 
 
    doc["readings"][0]["specie"] = "pm25"; 
    doc["readings"][0]["value"] = pm25_concentration; 
    doc["readings"][0]["unit"] = "µg/m3"; 
 
    doc["readings"][1]["specie"] = "pm10"; 
    doc["readings"][1]["value"] = pm10_concentration; 
    doc["readings"][1]["unit"] = "µg/m3"; 
 
    static char json_body[1024]; 
    serializeJson(doc, json_body); 
 
    HTTPClient http; 
    http.begin("https://aqicn.org/sensor/upload"); 
    http.addHeader("Content-Type", "application/json"); 
    int httpResponseCode = http.POST(json_body); 
 
    if (httpResponseCode > 0) 
    { 
 
        String response = http.getString(); 
        Serial.println(httpResponseCode); 
        Serial.println(response); 
    } 
    else 
    { 
 
        Serial.print("Error on sending POST: "); 
        Serial.println(httpResponseCode); 
    } 
 
    http.end(); 
}
API Options

Parameter Type Optional/Mandatory Explanations
token string mandatory

Get your own token from aqicn.org/data-platform/token.

station
station.id string mandatory

Unique station ID - you can select any name with max 128 characters.
This name is only used internally for you. No one else will see this ID

station.name string optional

Name of the station - could be for instance the name of your building, the name of a street, the name of a university departement, the code of your personal weather station.
This name will be used as the suffix for your station URL.

station.latitude float optional

Longitude of your station

station.longitude float optional

Longitude of your station

organization
org.website string optional

If you have a website with more information about your station/sensor, we will add this link on our map when used see your station

org.name string optional

If you specify a website, this "organization name" will be associated to the website.

readings
readings[*].specie string mandatory

Name of the pollutant your are reporting. For gas sensors, use: "pm2.5", "pm10", "pm1.0", ... For gaz sensor, use: "co2", "no2", "o3", ... For weather sensor, use: "temp", "humidity", "pressure", "wind speed", "wind gust", "wind direction", ..
You can actually use any specie name you want. When you station is validated, the names will be normalized in our system.

readings[*].value float mandatory

If your sensor is producing values every second, and you only upload every minute, this value should be the average of all the values read during the past minute.

readings[*].unit string optional

Unit of the value. Eg "mg/m3" for dust sensor, ppb for gas sensors, C for temp sensor..

readings[*].time string optional

Date and Time of the reading in ISO 8601 format

readings[*].min float optional

If the reading values are based on the averaging of several values, then this correspond to the min value of all values used for the averaging.

readings[*].max float optional

If the reading values are based on the averaging of several values, then this correspond to the max value of all values used for the averaging.

readings[*].median float optional

If the reading values are based on the averaging of several values, then this correspond to the median value of all values used for the averaging.

readings[*].stddev float optional

If the reading values are based on the averaging of several values, then this correspond to the standard deviation of all values used for the averaging.

readings[*].averaging float optional

If the above values are based on the averaging of several values, then this correspond to the duration, in seconds, of the averaging period.
For instance, use 60 for a minute average data and 3600 for hourly average.

Example 1

{ 
	"token": "......", 
	"station": { 
		"id": "station-001", 
		"name": "HCPA Santa Cecília", 
		"latitude": 103.37893, 
		"longitude": 43.17108, 
	}, 
	"org": { 
		"website":"https://pacto.upsensor.com/", 
		"name":"Porto Ar Alegre", 
	}, 
	"readings": [ 
		{"time":"2024-10-18T12:33:17+09:00","specie":"pm2.5", "value": 393.3, "unit":"mg/m3", "min":390.3, "max": 402.3, "stddev": 0.332},  
		{"time":"2024-10-18T12:33:17+09:00","specie":"pm10", "value": 109.3, "unit":"mg/m3"}, 
		{"time":"2024-10-18T12:33:17+09:00","specie":"co2", "value": 459.3, "unit":"ppb"}, 
		{"time":"2024-10-18T12:33:17+09:00","specie":"temp", "value": 26.8, "unit":"C"}, 
	] 
}

Example 2

{ 
	"token": "......", 
	"station": { 
		"id": "station-001", 
	}, 
	"readings": [ 
		{"specie":"pm2.5", "value": 393.3} 
	] 
}

Complete Code example

You can use this code for continuously reading from an SDS sensor, and uploading every minute: (script also available from https://github.com/aqicn/sds-sensor-reader).

import requests 
import random 
import time 
import math 
import json 
import sys 
from serial import Serial 
 
LOCATION = {'latitude': 28.7501, 'longitude': 77.1177} 
TOKEN    = "dummy-token-for-test-purpose-only" 
SENSORID = "station-001" 
USBPORT  = "/dev/ttyUSB0" 
 
class SensorDataUploader: 
 
    def __init__(self, station, token): 
        self.token = token 
        self.station = station 
 
 
    def send(self,readings): 
 
        params = {'station':self.station,'readings':readings,'token':self.token}  
        print("Uploading: %s"%json.dumps(params, indent=4)) 
 
        request = requests.post( url = "https://aqicn.org/sensor/upload/",  json = params) 
        data = request.json()  
        if data["status"]!="ok": 
            print("Something went wrong: %s" % data) 
        else: 
            print("Data successfully posted: %s"%data) 


class Accumulator: 
 
    def __init__(self, name): 
        self.name = name 
        self.values = [] 
 
    def add(self,val): 
        self.values.append(val) 
 
    def count(self): 
        return len(self.values) 
 
    def reset(self): 
        self.values=[] 
 
    def min(self): 
        return self.values[0] 
 
    def max(self): 
        return self.values[len(self.values)-1] 
 
    def median(self): 
        return self.values[len(self.values)/2] 
 
    def mean(self): 
        return float(sum(self.values)) / len(self.values) 
 
    def stddev(self): 
        l = len(self.values) 
        mean = self.mean() 
        return math.sqrt(float(reduce(lambda x, y: x + y, map(lambda x: (x - mean) ** 2, self.values))) / l) 
 
 
    def summary(self): 
        self.values.sort() 
        return {"specie":self.name,'value':self.mean(),'min':self.min(),'max':self.max(),'median':self.median(), 'stddev':self.stddev()}  


class DummyReader: 
 
    def read( self ): 
 
        time.sleep(1.1) 
        return {"pm2.5":random.random()*10,"pm10":random.random()*10} 
 
 
class SDS011Reader: 
 
    def __init__(self, inport): 
        self.serial = Serial(port=inport,baudrate=9600) 
        self.values = [] 
        self.step = 0 
 
    def read( self ): 
 
        # time.sleep(1) 
        # return {"pm2.5":random.random()*100,"pm10":random.random()*100} 
 
        while self.serial.inWaiting()!=0: 
            v=ord(self.serial.read()) 
 
            if self.step ==0: 
                if v==170: 
                    self.step=1 
 
            elif self.step==1: 
                if v==192: 
                    self.values = [0,0,0,0,0,0,0] 
                    self.step=2 
                else: 
                    self.step=0 
 
            elif self.step>8: 
                self.step =0 
                pm25 = (self.values[0]+self.values[1]*256)/10 
                pm10 = (self.values[2]+self.values[3]*256)/10 
                return {"pm2.5":pm25,"pm10":pm10} 
 
            elif self.step>=2: 
                self.values[self.step-2]=v 
                self.step= self.step+1 
 
        return None 


def readAndUpload(sensor, uploader): 
 
    try: 
 
        while True: 
            accumulators = {} 
            startTime = time.time() 
 
            while time.time() < startTime+60: 
                values = sensor.read() 
                if values==None: 
                    continue 
 
                print("Reading [%2d]: %s"%(int(time.time()-startTime),values)) 
                for specie, value in values.items(): 
                    if not (specie in accumulators): 
                        accumulators[specie]=Accumulator(specie) 
                    accumulators[specie].add(value) 
 
 
            readings = [] 
            for specie, accumulator in accumulators.items(): 
                readings.append(accumulator.summary()) 
 
            if len(readings)>0: 
                uploader.send(readings) 
            else: 
                print("No value read from the sensor...") 
 
 
    except KeyboardInterrupt: 
        print "Bye" 
        sys.exit() 


print("Starting reading sensor "+SENSORID+" on port "+USBPORT) 
 
# Station parameter   
station = {'id':SENSORID, 'location':LOCATION} 
uploader = SensorDataUploader(station, TOKEN) 
 
sensor = SDS011Reader(USBPORT) 
# sensor = DummyReader() 
readAndUpload(sensor,uploader) 
 

Know any Air Quality station in your surroundings?
Participate with your own air quality monitoring station

Our GAIA air quality monitors are very easy to set up: You only need a WIFI access point and a USB compatible power supply.

Once connected, your real time air pollution levels are instantaneously available on the maps and through the API.

The station comes with a 10-meter water-proof power cable, a USB power supply, mounting equipment and an optional solar panel.

À propos de la qualité de l'air et des mesures de la pollution atmosphérique :

À propos des niveaux de qualité de l'air

IQANiveau de pollution de l'air Impact sur la santé
0 - 50 Bon La qualité de l'air est jugée satisfaisante, et la pollution de l'air pose peu ou pas de risque.
51 -100 Modéré La qualité de l'air est acceptable. Cependant, pour certains polluants, il peut y avoir un risque sur la santé pour un très petit nombre de personnes inhabituellement sensibles à la pollution atmosphérique.
101-150 Mauvais pour les groupes sensibles La qualité de l'air est acceptable; Cependant, pour certains polluants, il peut y avoir un problème de santé modérée pour un très petit nombre de personnes qui sont particulièrement sensibles à la pollution de l'air.
151-200 Mauvais Tout le monde peut commencer à ressentir des effets sur la santé; les membres des groupes sensibles peuvent ressentir des effets de santé plus graves.
201-300 Très mauvais Avertissements de santé de conditions d'urgence. Toute la population est plus susceptible d'être affecté.
300+ Dangereux Alerte de santé: tout le monde peut ressentir des effets de santé plus graves.

Pour en savoir plus sur la qualité de l'air, consultez le sujet Qualité de l'air sur Wikipedia ou le guide AirNow de la qualité de l'air et de votre santé .

Pour des conseils de santé très utiles du Dr. Richard Saint Cyr, consultez le blog myhealthbeijing.com.


Notice d'utilisation: Toutes les données sur la qualité de l'air ne sont pas validées au moment de la publication et, pour des raisons d'assurance de la qualité, ces données peuvent être modifiées à tout moment et sans préavis. Le projet Indice de la qualité de l'air dans le monde a exercé toutes les compétences et l'attention réalisables dans la compilation du contenu de ces informations. Indice de la qualité de l’air dans le monde , l’équipe de projet ou ses agents ne peuvent être tenus responsables, contractuellement, judiciairement ou autrement, de toute perte, blessure ou préjudice résultant directement ou indirectement de la fourniture de ces données.


Paramètres


Choix de la langue :


Temperature unit:
Celcius