AirNet sensors Data Quality Validation Service
(10) อาคาร 27 โครงการบ้านเอื้ออาทรบางโฉลง, Bang Chalong Subdistrict, Thailand

Welcome to the AirNet Sensor Data Quality Validation service.

Station: (10) อาคาร 27 โครงการบ้านเอื้ออาทรบางโฉลง, Bang Chalong Subdistrict, Thailand also known as "CUSense by Chulalongkorn University 868333031257831" located at "Bang Chalong Subdistrict, Bang Chalong Subdistrict Administrative Organization, Bang Phli District, Samut Prakan Province, Thailand".

Explanations

On the first graph below (labeled "data readings confidence zone"), the red line represents the hourly readings from the sensor, while the green line represents the median of the hourly readings of the station neighbors.

The zone filled in green represents the confidence zone, equivalent to 3 times the standard deviation of the neighbor stations.

Each time the station hourly reading goes above the confidence zone, the station is considered producing abnormal reading.

The larger the difference between the hourly reading and confidence zone, the more likely the station is considered as producing invalid data.

The formula is defined as:

\( d_i = {v_i - median_i \over {stddev_i }} \) , \( P = \sum_i ( \begin{cases} 1/n & d_i>5 \\ 0 & otherwise \end{cases} ) \) , \( D = \sqrt {\sum_i {d_i} \over n} \)
P=probability, D=distance and W=P*D

where 'i' is iterated over the past 3 days data and 'n' is the number of samples during those past 3 days (most likely n = 24*3).

If W>30, the station is automatically disabled.

Show me the data

Further questions

If you have any question or comment, send us a message using the form below:

Know any Air Quality station in your surroundings?
Participate with your own air quality monitoring station

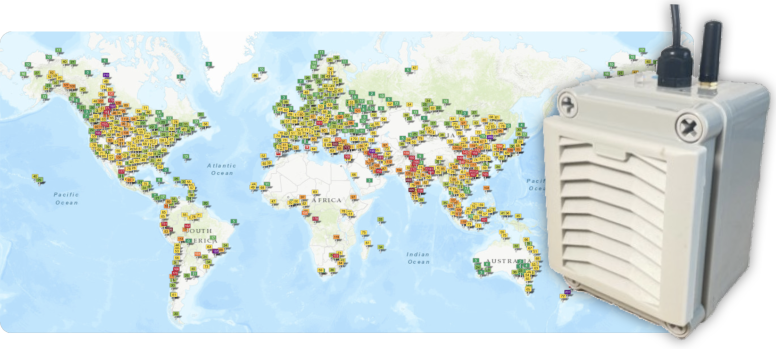
Our GAIA air quality monitors are very easy to set up: You only need a WIFI access point and a USB compatible power supply.

Once connected, your real time air pollution levels are instantaneously available on the maps and through the API.

The station comes with a 10-meter water-proof power cable, a USB power supply, mounting equipment and an optional solar panel.

大気汚染指数の測定方法:

大気汚染レベルについて

指数 大気質指数の分類(米国) 健康影響 / カテゴリ 粒子状物質(PM10,PM2.5)
0 - 50 良い - Good 通常の活動が可能 なし
51 -100 並 - Moderate 特に敏感な者は、長時間又は激しい屋外活動の減少を検討 非常に敏感な人は、長時間または激しい活動を減らすよう検討する必要がある。
101-150 敏感なグループにとっては健康に良くない - Unhealthy for Sensitive Groups 心臓・肺疾患患者、高齢者及び子供は、長時間又は激しい屋外活動を減少 心疾患や肺疾患を持つ人、高齢者、子供は、長時間または激しい活動を減らす必要がある。
151-200 健康に良くない - Unhealthy 上記の者は、長時間又は激しい屋外活動を中止
すべての者は、長時間又は激しい屋外活動を減少
心疾患や肺疾患を持つ人、高齢者、子供は、長時間または激しい活動を中止する必要がある。それ以外の人でも、長時間または激しい活動を減らす必要がある。
201-300 極めて健康に良くない - Very Unhealthy 上記の者は、すべての屋外活動を中止
すべての者は、長時間又は激しい屋外活動を中止
心疾患や肺疾患を持つ人、高齢者、子供は、全ての屋外活動を中止する必要がある。それ以外の人でも、長時間または激しい活動を中止する必要がある。
300+ 危険 - Hazardous 上記の者は、屋内に留まり、体力消耗を避ける
すべての者は、屋外活動を中止
全ての人が屋外活動を中止する必要がある。特に、心疾患や肺疾患を持つ人、高齢者、子供は、屋内に留まって激しい活動を避け静かに過ごす必要がある。
(Reference: see wikipedia, and cn.emb-japan.go.jp/)

大気汚染についての更なる詳細をお知りになりたい方は、WikipediaAirNowを参照してください。

北京在住の医師Richard Saint Cyr氏による大変役に立つ健康上のアドバイスは、 www.myhealthbeijing.com をご覧ください。


使用上の注意: すべての大気質データは公開時点では妥当性が担保されていないため、これらのデータは予告なしに修正することがあります。 世界大気質指数プロジェクトは、この情報の内容を編集に最善の注意を尽くしておりますが、いかなる状況においても World Air Quality Index プロジェクトチームまたはそのエージェントは、このデータの供給によって直接的または間接的に生じる損失や損害について責任を負いません。


設定


言語を選択:


Temperature unit:
Celcius