AirNet sensors Data Quality Validation Service
Fitzwilliam Lane, Dublin, Ireland

Welcome to the AirNet Sensor Data Quality Validation service.

Station: Fitzwilliam Lane, Dublin, Ireland also known as "Citizen Science project sensor.community 70846" located at "Fitzwilliam Lane, Dublin, Dublin 2, Leinster, 2, Ireland".

Explanations

On the first graph below (labeled "data readings confidence zone"), the red line represents the hourly readings from the sensor, while the green line represents the median of the hourly readings of the station neighbors.

The zone filled in green represents the confidence zone, equivalent to 3 times the standard deviation of the neighbor stations.

Each time the station hourly reading goes above the confidence zone, the station is considered producing abnormal reading.

The larger the difference between the hourly reading and confidence zone, the more likely the station is considered as producing invalid data.

The formula is defined as:

\( d_i = {v_i - median_i \over {stddev_i }} \) , \( P = \sum_i ( \begin{cases} 1/n & d_i>5 \\ 0 & otherwise \end{cases} ) \) , \( D = \sqrt {\sum_i {d_i} \over n} \)
P=probability, D=distance and W=P*D

where 'i' is iterated over the past 3 days data and 'n' is the number of samples during those past 3 days (most likely n = 24*3).

If W>30, the station is automatically disabled.

Show me the data

Further questions

If you have any question or comment, send us a message using the form below:

Know any Air Quality station in your surroundings?
Participate with your own air quality monitoring station

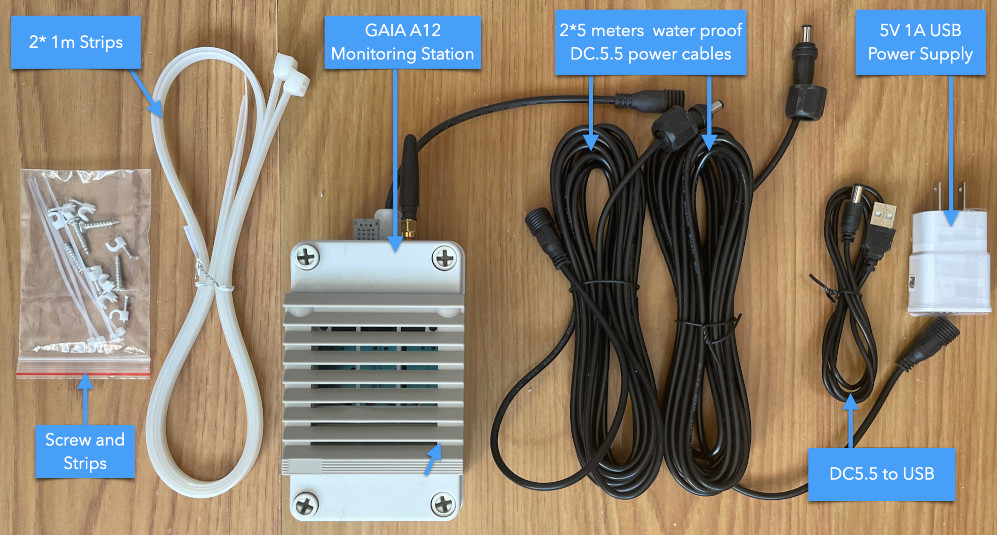
Our GAIA air quality monitors are very easy to set up: You only need a WIFI access point and a USB compatible power supply.

Once connected, your real time air pollution levels are instantaneously available on the maps and through the API.

The station comes with a 10-meter water-proof power cable, a USB power supply, mounting equipment and an optional solar panel.

Over de luchtkwaliteit- en vervuilingsmeting:

Over de luchtkwaliteitsniveaus

- Luchtkwaliteitsindex (AQI)-waardenNiveaus van gezondheidsproblemen
0 - 50 Goed Luchtkwaliteit wordt als bevredigend beschouwd en luchtverontreiniging vormt weinig of geen risico
51 -100 Matig Luchtkwaliteit is acceptabel; voor sommige verontreinigende stoffen kan er echter sprake zijn van een matige gezondheidsrisico voor een zeer klein aantal mensen dat ongewoon gevoelig is voor luchtvervuiling.
101-150 Ongezond voor gevoelige groepen Leden van gevoelige groepen kunnen gezondheidseffecten ervaren. Het grote publiek zal waarschijnlijk niet worden beïnvloed.
151-200 Ongezond Iedereen kan gezondheidseffecten ervaren; leden van gevoelige groepen kunnen ernstiger gezondheidseffecten ervaren
201-300 Zeer Ongezonde Gezondheidswaarschuwingen voor noodomstandigheden. De volledige populatie is mogelijk getroffen.
300+ gevaarlijk Gezondheidswaarschuwing: iedereen kan ernstigere gezondheidseffecten ervaren

Als u meer wilt weten over luchtkwaliteit en vervuiling, raadpleegt u het Wikipedia-onderwerp Luchtkwaliteit of de airnow-gids voor luchtkwaliteit en uw gezondheid .

Voor zeer nuttige gezondheidsadviezen van de Beijing-arts Richard Saint Cyr MD, kijk op de blog www.myhealthbeijing.com .


Gebruiksmelding: Alle gegevens van de luchtkwaliteit zijn niet-gevalideerd op het moment van publicatie en als gevolg van kwaliteitsborging kunnen deze gegevens op elk gewenst moment zonder voorafgaande kennisgeving worden gewijzigd. Het World Air Quality Index -project heeft alle redelijke vaardigheid en zorg besteed aan het samenstellen van de inhoud van deze informatie en onder geen enkele voorwaarde zal de World Air Quality Index projectteam of zijn agenten zijn aansprakelijk in contract, onrechtmatige daad of anderszins voor enig verlies, letsel of schade die direct of indirect voortvloeit uit de levering van deze gegevens.


Settings


Language Settings:


Temperature unit:
Celcius