The Shanghai Dylos Air Quality experiment
Real-time Air Quality readings from Shanghai

ແບ່ງປັນ: aqicn.org/sensor/shanghai/lo/

Introduction

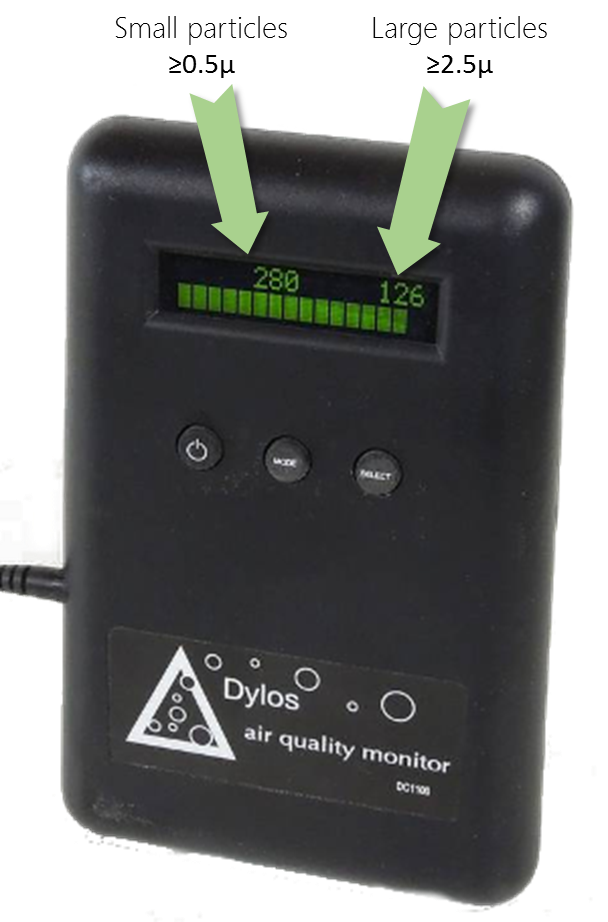
For more information about those real-time dylos and BAM monitor PM2.5 and PM10 readings, please refer to our article on the Dylos Air Particule Counter experimentation.

Oops.. It seems that your browser does not support advanced visualization (error TypeError: $.getJSON(...).error is not a function)... So, please, download a real browser if you want to see this page! Both firefox (http://www.mozilla.org/en-US/firefox/new/) and Google Chrome (www.google.com/chrome/) have been verified ok with this page...

If it was working, you would be able to see this page:
If you want to know about other affordarable Air Quality Sensors such as Shinyei and Samyoung, check our sensor overview page.
There is currently no Dylos station active in Shanghai, so the correlation data similar to Beijing can not be provided.
If you have a dylos monitor in shanghai, and want to join the experiment, just contact us and we will provide you the details to setup your equipment.

Time series graphs

Those two graphs show the last 30 days data correlation for the Dylos monitor (in blue) and Jing'an (静安监测站) BAM monitor (in red).


Error: TypeError: $.getJSON(...).error is not a function
PM2.5 time graph (BAM, PM2.5 in µg/m3, Dylos ≥0.5µ particules count)
Tue 11Thu 13Sat 15Mon 17Wed 19Fri 21Mar 23Tue 25Thu 27Sat 29Mon 31AprilThu 03Sat 05Mon 07050K100K150K200K250K300K
PM2.5 BAM and Dylos correlation graph.
PM10 time graph (BAM, PM10 in µg/m3, Dylos ≥2.5µ particules count)
PM10 BAM and Dylos correlation graph.

Variation between stations

The next 2 graphics show the PM2.5 and PM10 raw values (in µg/m3) for different BAM stations (i.e. without the Dylos values) in Shanghai, for the last 15 days. This is provided to ensure that there is not significant devitation between the various stations, especially considering that some are located on the road side, while others are in the living area.
Jingan (静安监测站), BAM PM.25 in µg/m3
Shanghai Normal College (卢湾师专附小), BAM PM2.5 in µg/m3
US Consulate (上海美国总领事馆), BAM PM2.5 in µg/m3

- -

For the list of all air quality sensors, check the Sensor Overview page

Read or publish comments (they rely on Disqus)

ກ່ຽວກັບການວັດແທກຄຸນນະພາບອາກາດ ແລະມົນລະພິດ:

ກ່ຽວກັບລະດັບຄຸນນະພາບອາກາດ

- ດັດຊະນີຄຸນນະພາບອາກາດ (AQI) ຄ່າLevels of Health Concern
0 - 50 ດີ ຄຸນນະພາບທາງອາກາດຖືກພິຈາລະນາເປັນທີ່ພໍໃຈ, ແລະມົນລະພິດທາງອາກາດກໍ່ມີຄວາມສ່ຽງຫນ້ອຍຫຼືບໍ່ມີຄວາມສ່ຽງ
51 -100 ປານກາງ ຄຸນນະພາບທາງອາກາດແມ່ນການຮັບຮອງ; ຢ່າງໃດກໍ່ຕາມ, ສໍາລັບບາງມົນລະພິດອາດມີຄວາມກັງວົນກ່ຽວກັບສຸຂະພາບໃນລະດັບປານກາງສໍາລັບຈໍານວນຜູ້ທີ່ມີຄວາມເຄັ່ງຕຶງທີ່ຜິດປົກກະຕິກັບການມົນລະພິດທາງອາກາດ.
101-150 Unhealthy
for sensitive groups
ສະມາຊິກຂອງກຸ່ມທີ່ມີຄວາມອ່ອນໄຫວອາດຈະມີຜົນກະທົບຕໍ່ສຸຂະພາບ ປະຊາຊົນທົ່ວໄປບໍ່ໄດ້ຮັບຜົນກະທົບ.
151-200 ບໍ່ມີສຸຂະພາບດີ ທຸກໆຄົນອາດຈະເລີ່ມປະສົບຜົນກະທົບດ້ານສຸຂະພາບ; ສະມາຊິກຂອງກຸ່ມທີ່ມີຄວາມອ່ອນໄຫວອາດຈະມີຜົນກະທົບດ້ານສຸຂະພາບທີ່ຮ້າຍແຮງຫຼາຍ
201-300 Very
Unhealthy
ການເຕືອນໄພດ້ານສຸຂະພາບຂອງສະພາບສຸກເສີນ. ປະຊາກອນທັງຫມົດແມ່ນມັກຈະໄດ້ຮັບຜົນກະທົບ.
300+ ອັນຕະລາຍ ເຕືອນດ້ານສຸຂະພາບ: ທຸກໆຄົນອາດຈະມີຜົນກະທົບທາງສຸຂະພາບທີ່ຮ້າຍແຮງກວ່າເກົ່າ

ເພື່ອຮູ້ເພີ່ມເຕີມກ່ຽວກັບຄຸນນະພາບອາກາດ ແລະມົນລະພິດ, ໃຫ້ກວດເບິ່ງ ຫົວຂໍ້ຄຸນນະພາບອາກາດຂອງ wikipedia ຫຼື ຄູ່ມື airnow ກ່ຽວກັບຄຸນນະພາບອາກາດ ແລະສຸຂະພາບຂອງເຈົ້າ .

ສໍາລັບຄໍາແນະນໍາດ້ານສຸຂະພາບທີ່ເປັນປະໂຫຍດຫຼາຍຂອງທ່ານຫມໍປັກກິ່ງ Richard Saint Cyr MD, ກວດເບິ່ງ blog www.myhealthbeijing.com .


ແຈ້ງການນໍາໃຊ້: ຂໍ້ມູນຄຸນນະພາບອາກາດທັງຫມົດແມ່ນບໍ່ຖືກຕ້ອງໃນເວລາທີ່ພິມເຜີຍແຜ່, ແລະເນື່ອງຈາກການຮັບປະກັນຄຸນນະພາບຂອງຂໍ້ມູນເຫຼົ່ານີ້ອາດຈະຖືກປັບປຸງ, ໂດຍບໍ່ມີຂໍ້ສັງເກດ, ໃນທຸກເວລາ. ໂຄງການດັດຊະນີທາງອາກາດໂລກໄດ້ໃຊ້ທັກສະແລະການດູແລທີ່ສົມເຫດສົມຜົນທັງຫມົດໃນການລວບລວມເນື້ອໃນຂອງຂໍ້ມູນນີ້ແລະພາຍໃຕ້ສະພາບການໃດກໍ່ຕາມທີມງານຂອງໂຄງການໂລກຂອງອາກາດທາງໂລກຫຼືຕົວແທນຂອງມັນຈະຮັບຜິດຊອບໃນສັນຍາ, ຄວາມເສຍຫາຍຫຼືຄວາມເສຍຫາຍໃດໆ, ເກີດຂື້ນໂດຍກົງຫຼືໂດຍທາງອ້ອມຈາກການສະຫນອງຂໍ້ມູນນີ້.


Settings


Language Settings:


Temperature unit:
Celcius