Guide to publishing Air Quality data on the World Air Quality Index project

Share: aqicn.org/publishingdata/

Publishing data on the World Air Quality Index project is free for every one. But it is also simple and straightforward: All you need to add data on the World Air Quality Index map is to provide a feed URL with the real-time information about the monitoring stations (name and location), the pollutants being measured and the real-time readings (together with the units, for instance milligrams or ppb).


Qualification Criteria

Note that, historically, the data published on the World Air Quality Index maps (aqicn.org and waqi.info) was only the official data provided by each country respective Environmental Protection Agency (see the full EPA list).

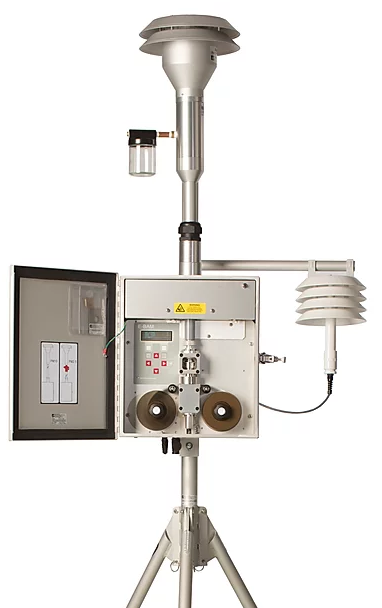
The official data refers to data monitored using professional BAM, TEOM and similar high-cost air quality monitoring stations. Those stations are not trivial to use, and do require constant maintenance and calibration by the EPA professional field-engineering teams.

However, nowadays, more affordable laser-scattering-based air quality monitoring stations are widely use as companion to the official air quality monitoring stations. Those more affordable station can cost 1000 times less than the BAM and TOEM station.

We do recommend to use the semi-professional GAIA air quality monitoring stations for this purpose. But we also accept data from other stations. Nevertheless, such particle counter-based stations need to report enhanced data feed with additional quality controls (see quality control section).

Feed format

Since almost every country has its own reporting format, the World Air Quality Index project can accept any kinds of formats for the feeds: They can be in CSV, JSON or just plain text or HTML format. You can find at the bottom of this page 3 example for CSV, HTML and JSON.

For reference, check the official feeds for Singapore or Netherlands and notice that despite they are all different, they can be ingested by our system.

For the instant air particle counters, you can either report the data via our own web server, or via the thingspeak.

Data ingestion

The World Air Quality Index system will take care of regularly checking the data from the feed, and each time an update is available, it will be processed, converted to the US EPA scale AQI values, and publish on the World Air Quality Index website within minutes.

Also, although only PM2.5, PM10, Ozone, NO2, SO2 and CO Air Quality data is published, the system does collect more pollutants for forecasting purpose: Benzen, Toluene, Ethylbenzene, NOx, THC, NMHC, PM1, Formaldehyde, Mercury, Ammonia, Methane, Hydrogen sulfide, Nitrous acid, Phenol, Naphthalene, paraxylene (p-Xylen), metaxylene (m-Xylen), etc..

It is also possible to publish meteorological data: Temperature, Atmospheric Pressure, Humidity, Precipitation, Wind Speed, Wind Direction, Solar Radiation and UVI. If not provided, we will use other relevant meteorologic information sources.

Feed Example (CSV format)

 #ID: ID_BEI_DC
#City: Beijing
#Station: Dongcheng
#Name: 东城东四
#Latitude: 39.929
#Longitude: 116.417
#Timezone: +0800
Date,PM10,PM25,CO,Ozone,Sulphur Dioxide,Nitrogen Dioxide,AmbientTemperature,RelativeHumidity,WindDirection,WindSpeed,Pressure,RainGauge
Unit,ug/m3,ug/m3,ppm,µg/m3,µg/m3,µg/m3,°C,%,°,m/s,hPa,mm
10/29/2016 13:00,16,3,,58,10,3,32,66,200,3,1001,0
10/29/2016 14:00,19,8,,57,9,4,32,64,197,2,1001,0
10/29/2016 15:00,15,9,,52,47,17,30,72,190,2,1001,0
10/29/2016 16:00,31,19,,52,34,17,30,75,191,2,1001,0
10/29/2016 17:00,31,17,,49,49,19,29,75,194,1,1002,0
10/29/2016 18:00,37,18,,45,55,25,29,73,183,1,1003,0
10/29/2016 19:00,24,13,,40,21,19,29,80,65,1,1004,0
10/29/2016 20:00,39,22,,44,4,16,28,85,7,1,1005,0
10/29/2016 21:00,24,16,,43,3,7,28,85,10,1,1005,0

Feed Example (HTML format)

This is an example based on an HTML format (direct url: publishingdata/html/):

Station list:
Station ID City or County Name Station Name Local name (optional) Latitude/Longitude Timezone (optional)
ID_BEI_DC Beijing Dongcheng 东城东四 39.929/116.417 +0800
ID_BEI_WP Beijing West Park 西城官园 39.929/116.339 +0800
ID_BEI_OP Beijing Olympic Park 朝阳奥体中心 39.982/116.397 +0800
... ... ... ... ... ...
  • The "Station ID" is the unique identifier for each station, and it can just be a number (eg ID8373), or the concatenation of station city and station name (eg. "Beijing/Dongcheng").
  • By default, the station will be available via the url /city/country-name/city-name/station-name.
  • The "Station Name" must use latin characters, so the optional "Local Name" can be provided to localize the webpage.

Real-time pollutant list:
Station ID Pollutant Unit Update time Value Averaging
ID_BEI_DC PM10 mg/m3 2024-03-28T09:00:00+09:0027.8 1 hour
ID_BEI_DC PM25 mg/m3 2024-03-28T09:00:00+09:0010.8 1 hour
ID_BEI_DC Ozone mg/m3 2024-03-28T09:00:00+09:0015.2 1 hour
ID_BEI_DC Ozone mg/m3 2024-03-28T09:00:00+09:0018.2 8 hours
ID_BEI_DC Temperature Celcius 2024-03-28T09:00:00+09:0022.3 1 hour
ID_BEI_WP PM10 mg/m3 2024-03-28T09:00:00+09:0027.8 1 hour
ID_BEI_WP PM25 mg/m3 2024-03-28T09:00:00+09:0010.8 1 hour
ID_BEI_WP SO2 ppb 2024-03-28T09:00:00+09:0015.2 1 hour
ID_BEI_WP Humidiy % 2024-03-28T09:00:00+09:0088 1 hour
... ... ... ... ...
  • The "Averaging" column is use to specify the duration of the value. The most common averaging is 1 hour. It is also the preferred one, as our backend system will automatically do the 8 hour averaging computation for the Ozone and Carbon Monoxide.
  • In the case the readings are provided more frequently than every hour (for instance every 30 minutes or 10 minutes), you can either provide the raw readings for the given period, or just the hourly averaging: Our back-end system will anyway process data even between the hour.

Feed Example (JSON format)

This is an example based on JSON format (direct url: /publishingdata/json/)

..

Quality Control for particle counter sensors

For instant particule counters, such as the Plantower PMS or Nova SDS, which provide instantaneous (in few seconds) particulate matter readings, the data is usually reported every minute. This data is usually computed based on several "averaged" readings from a one or two minute period.

The use of averaging is however not good enough, especially for failing sensors (or sensor close of end-of-life). Therefore, for such sensors, it is required to provide additional metrics, such as the median, min, max, and standard-deviation. See for example the readings object in the below JSON data feed.

..

You can use the following arduino-compatible code to collect those metrics:

class Accumulator 
{ 
    #define OUTPUT_BUFFER_SIZE 120 
    char buffer[OUTPUT_BUFFER_SIZE]; 
 
    #define MAXACCVALUES 120 
    int vals[MAXACCVALUES]; 
 
    int count = 0; 
 
public: 
    Accumulator() 
    { 
        reset(); 
    } 
 
    void reset() 
    { 
        count = 0; 
        for (int i=0;i< MAXACCVALUES;i++)  
        { 
            vals[i]=0; 
        } 
    } 
 
    bool hasData()  
    { 
        return count!=0; 
    } 
 
    std::string output()  
    { 
        if (!hasData()) return std::string("{}"); 
 
        sprintf(buffer, OUTPUT_BUFFER_SIZE, "{\"min\":%d,\"max\":%d,\"median\":%d,\"average\":%.1f,\"stddev\":%.1f,\"count\":%d}",  
            vmin(), vmax(), median(), average(), stddev(), count); 
 
        return std::string(buffer); 
 
    } 
 
    void add(int val) 
    { 
        if (count==MAXACCVALUES-1) { 
          for (int i = 0; i < MAXACCVALUES - 1; i++) { 
            vals[i] = vals[i + 1]; 
            } 
            count --; 
        } 
        vals[count++]=val; 
    } 
 
    float stddev()  
    { 
        if (!hasData()) return -1; 
        int u  =avg(); 
        int t = 0; 
        for (int i=0;ivals[j]) { 
                    float t = vals[j]; 
                    vals[j]=vals[i]; 
                    vals[i]=t; 
                } 
  
            } 
        } 
        return vals[count/2]; 
    } 
 
    float avg()  
    { 
        if (!hasData()) return -1; 
        float t = 0; 
        for (int i=0;ivals[i]) { 
                t=vals[i]; 
            } 
        } 
        return t; 
    } 
 
    float vmax()  
    { 
        if (!hasData()) return -1; 
        float t = vals[0]; 
        for (int i=0;it) { 
                t=vals[i]; 
            } 
        } 
        return t; 
    } 
};

Inquiry Form


MetOne BAM 1020 station

Publishing data on the World Air Quality Index maps (aqicn.org and waqi.info) is free and simple.

Both professional and DIY air quality monitoring stations are accepted.

However DIY stations, such as "luftdaten", go through an additional data quality control, to ensure high quality data.

Once your data is validated, you will get a dedicated page for your station where you can see the real-time data, the Air Quality and weather forecast, as well as the historical data - all for free.

If you do not have any monitoring station, and would like to get one, check our GAIA Air Quality monitoring stations. If you prefer a DIY station, check the GAIA A08.


--

Uploading the data

There are three cases in order to upload your data into the map:

    Either you have a known Air Quality monitoring station (IQAir, Oizom, Luftdaten, PurpleAir, U-Rad, LUN, ...), or a known Weather Station with an air quality sensor module (Weather Link, Eco-Witt, c...). In which case, you only need to tell us your station details, such as the ID/Name. We already have adapters for those stations.


    Either you already have a website (or a feed such as thing-speak) from which we can collect the data from your stations. In this case our system will periodically load your page, extract the data and then republish it on our map. Check the feed examples for website examples.


    Either you do not have a website, but you have a station, and you would like to "push" the data directly to our system. In this case, you will need to write a small program to "post" your station data via our upload API. We have code example for Arduino and Python. The code samples are available from the upload API page.


If you fall in the two first categories (have a known station or a website), or if you have any doubts, send us a message using the form below. If you fall in the second category, and want to programmatically post the data via our upload API, check our data upload scripts and API page.

Contact form

Your name - eg "John Doe"


Your email address - eg "john.doe@mail.com"


Your data-feed URL - eg "https://airnow.gov/"
or station Id - eg "https://weatherlink.com/..."

Tell us what kind of help you need or can provide.

Data Validation

If you own a luftdaten or similar low cost sensor, you can check the air quality data validation service:

https://aqicn.org/data-feed/validation/

For example, for the "luftdaten" sensor 84804, you can check the page aqicn.org/data-feed/validation/#/luftdaten/84804

The data validation and qualification is also done automatically once a day.

Measure the air quality in your neighborhood
Participate with your own air quality monitoring station

The GAIA air quality monitor uses laser particle sensors to measure in real-time PM2.5 and PM10 particle pollution, which is one of the most harmful air pollutants.

It is very easy to set up: It only requires a WIFI access point and a USB compatible power supply. Once connected, your real time air pollution levels are instantaneously available in on our maps.

The station comes together with 10-meter water-proof power cables, a power supply, mounting equipment and an optional solar panel.

About the Air Quality and Pollution Measurement:

About the Air Quality Levels

AQI Air Pollution Level Health Implications Cautionary Statement (for PM2.5)
0 - 50 Good Air quality is considered satisfactory, and air pollution poses little or no risk None
51 -100 Moderate Air quality is acceptable; however, for some pollutants there may be a moderate health concern for a very small number of people who are unusually sensitive to air pollution. Active children and adults, and people with respiratory disease, such as asthma, should limit prolonged outdoor exertion.
101-150 Unhealthy for Sensitive Groups Members of sensitive groups may experience health effects. The general public is not likely to be affected. Active children and adults, and people with respiratory disease, such as asthma, should limit prolonged outdoor exertion.
151-200 Unhealthy Everyone may begin to experience health effects; members of sensitive groups may experience more serious health effects Active children and adults, and people with respiratory disease, such as asthma, should avoid prolonged outdoor exertion; everyone else, especially children, should limit prolonged outdoor exertion
201-300 Very Unhealthy Health warnings of emergency conditions. The entire population is more likely to be affected. Active children and adults, and people with respiratory disease, such as asthma, should avoid all outdoor exertion; everyone else, especially children, should limit outdoor exertion.
300+ Hazardous Health alert: everyone may experience more serious health effects Everyone should avoid all outdoor exertion

To know more about Air Quality and Pollution, check the wikipedia Air Quality topic or the airnow guide to Air Quality and Your Health.

For very useful health advices of Beijing Doctor Richard Saint Cyr MD, check www.myhealthbeijing.com blog.


Usage Notice: All the Air Quality data are unvalidated at the time of publication, and due to quality assurance these data may be amended, without notice, at any time. The World Air Quality Index project has exercised all reasonable skill and care in compiling the contents of this information and under no circumstances will the World Air Quality Index project team or its agents be liable in contract, tort or otherwise for any loss, injury or damage arising directly or indirectly from the supply of this data.


Settings


Language Settings:


Temperature unit:
Celcius