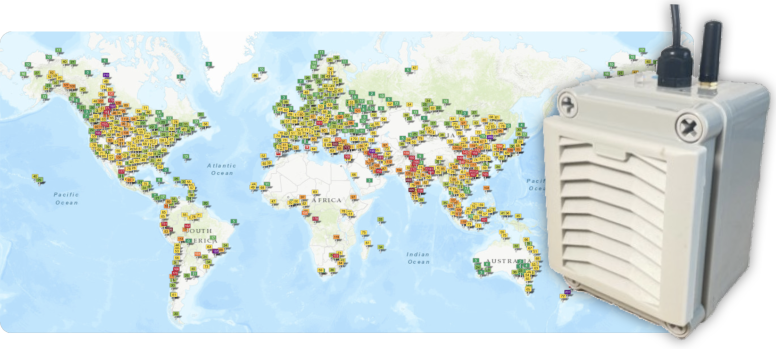
Shanghai Air Quality Forecast

Dijeli: aqicn.org/forecast/shanghai/bs/
Other Cities

The detailed forecast analysis is also available for other cities:

Or just select any of those cities:

Beijing, Chengdu, Shenyang, Shenzhen, Guangzhou, Qingdao, Xian, Tianjin, Saitama, Kyoto, Osaka, Seoul, Busan, Bogota, Delhi, Jakarta, Ulaanbaatar, Hanoi, Chennai, Kolkata, Mumbai, Hyderabad, Santiago, Lima, Saopaulo, Quito, Singapore, Kuala-lumpur, Ipoh, Perai, Miri, New York, Seattle, Chicago, Boston, Atlanta

For other cities, countries or pollutants, please refer to world air quality forecast maps:

https://waqi.info/forecast/bs/

Forecast Map

City Forecast

Model Comparison

This section is experimental. It provides the comparison for the prediction for several individual forecast models

For a full list of all Air Quality Forecast models being analyser, check the forecast models page: https://aqicn.org/forecast/models/bs/

Forecast Analysis

How accurate are the forecasts?

Check the correlation graphs below for PM2.5, PM10 and Ozone for the past 30 days.

(Note that all values are based on the AQI, and that a maximum threshold of AQI 300 is used).


Past month PM2.5 AQI short-term forecast analysis.

In the above graph, the forecast is data is the forecast one day in advance (i.e. the forecast computed today for tomorrow).

Air Quality Forecasts Models

There are many forecast models, for different regions of the globe - below are few of them.

Just click on any of them to see the animated map for the given model.

For a full list of all Air Quality Forecast models being analyser, check the forecast models page: https://aqicn.org/forecast/models/bs/


Please note that all above analysis are done on the World Air Quality Index (WAQI) project own budget.

We did not receive any subsidies from any of the intuitions publishing Air Quality forecast models.


Future Improvements

We need your help

Help is needed for keeping the world-wide Air Quality forecast model inventory up-to-date.

  • Do you know any model not listed below but for which gridded data is available?
  • Do you know better accuracy analysis solutions which should be used here?
  • Have you done a similar research and you would like to publish it here?
  • If yes, drop us a message from the contribute page and we will contact you asap!

    Forecast Model Sources

    The above prediction is based on composite meta model, computed using several Air Quality Forecasting Systems (AQFS):

    The above map is based on the PM2.5 surface level modeling, and colors are following the US EPA AQI standard.

    Disclaimer

    This forecasting model, and all AQFS which it is based on, are research products intended to provide information related to Air Quality forecast. All reasonable measures have been taken to ensure its quality and accuracy. However:

    • We do not make warranty, express or implied, nor assume any legal liability or responsibility for the accuracy, correctness, completeness of the information.
    • We do not assume any legal liability or responsibility for any damage or loss that may directly or indirectly result from any information contained on this website or any actions taken as a result of the content of this website;
    • We may change, delete, add to, or otherwise amend information contained on this website without notice

    For more information about the underlying concepts of Air Quality forecasting (or Atmospheric Dispersion Modeling), check the article on a visual study of wind impact of PM2.5 concentration.

    O mjerenju kvalitete zraka i zagađenja:

    O razinama kvalitete zraka

    - Vrijednosti indeksa kvalitete zraka (AQI).Nivoi zdravstvene brige
    0 - 50 Dobro Kvalitet vazduha se smatra zadovoljavajućim, a zagađenje vazduha predstavlja mali ili nikakav rizik
    51 -100 Umereno Kvalitet zraka je prihvatljiv; Međutim, neki zagađivači mogu imati umjereno zabrinjavajući utjecaj na zdravstveno stanje malog broja ljudi koji su veoma osjetljivi na zagađenje zraka.
    101-150 Nezdravo za osetljive grupe Može prouzrokovati zdravstvene poteškoće kod članova osjetljivih grupa. Većina verovatno neće biti pogođena.
    151-200 Nezdravi Svako može početi osjećati posljedice na zdravlje; članovi osjetljivih grupa mogu imati ozbiljnije zdravstvene posljedice
    201-300 Veoma nezdravim Upozorenja o hitnim slučajevima. Čitava populacija će biti pogođena.
    300+ Opasno Zdravstveno upozorenje: svako može osjetiti ozbiljnije posljedice na zdravlje

    Da biste saznali više o kvaliteti zraka i zagađenju, provjerite temu wikipedije o kvaliteti zraka ili airnow vodiču za kvalitet zraka i vaše zdravlje .

    Za vrlo korisne zdravstvene savjete pekinškog doktora Richarda Saint Cyr MD, posjetite blog www.myhealthbeijing.com .


    Upotreba: Svi podaci o kvalitetu vazduha su neverifikovani u vrijeme objavljivanja, a zbog osiguranja kvaliteta ovi podaci mogu biti izmjenjeni i dopunjeni u bilo kom trenutku. Projekat Svjetskog indeksa kvaliteta vazduha obratio je veliku pažnju prilikom sastavljanja ovih informacija i ni pod kakvim okolnostima neće biti Svjetski indeks kvaliteta vazduha projektni tim ili njegovi agenti odgovorni za ugovor, štetu ili bilo kakav gubitak, povredu ili štetu nastalu direktno ili indirektno iz snabdevanja ovim podacima.


    Settings


    Language Settings:


    Temperature unit:
    Celcius